4-47
4-4 Regenerative Energy Absorption
4
System Design
Vertical Axis
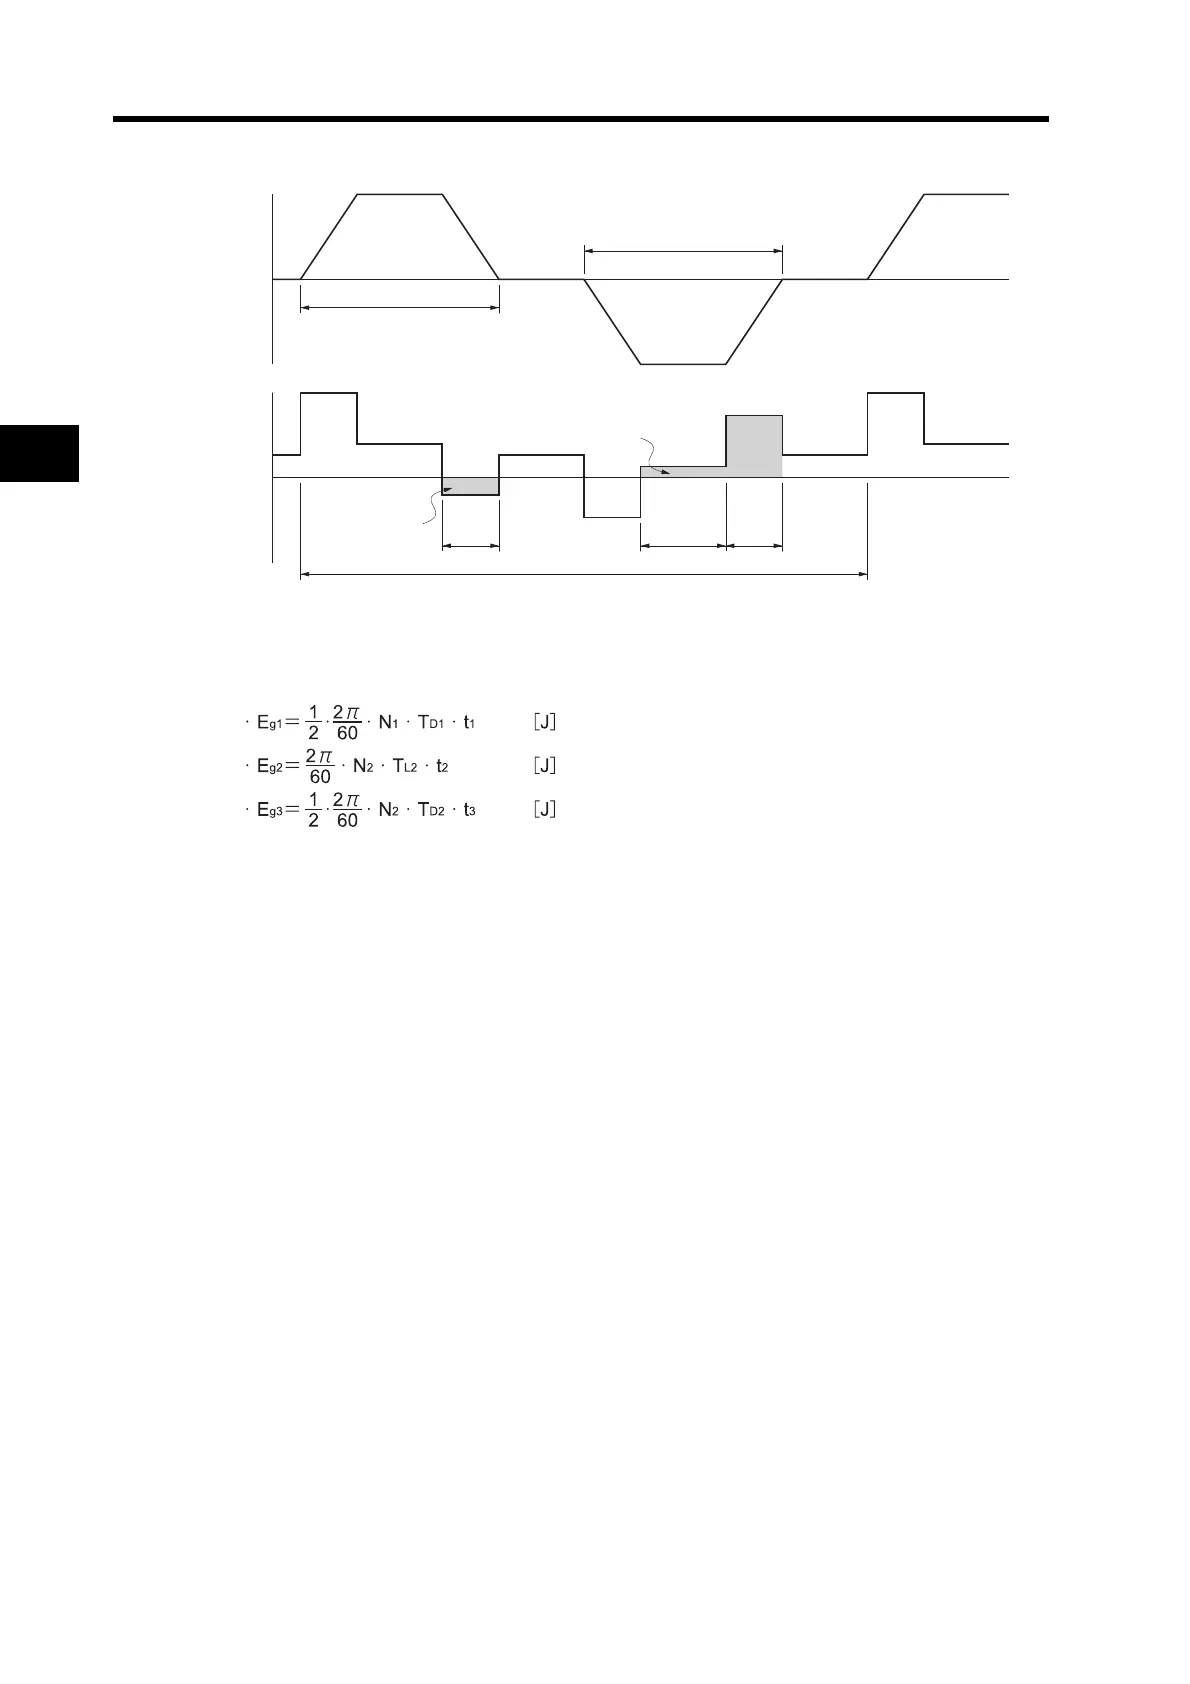
• In the output torque graph, acceleration in the positive direction (rising) is shown as positive, and
acceleration in the negative direction (falling) is shown as negative.
• The regenerative energy values in each region can be derived from the following equations.
Note Due to the loss of winding resistance, the actual regenerative energy will be approximately
90% of the values derived from these equations.
• For Servo Drive models with internal capacitors used for absorbing regenerative energy (i.e.,
models of 400 W or less.), the values for both E
g1
or E
g2
+ E
g3
(unit: J) must be lower than the
Servo Drive’s regenerative energy absorption capacity. (The capacity depends on the model. For
details, refer to Servo Drive Regenerative Energy Absorption Capacity on page 4-48.)
• For Servo Drive models with an internal regeneration resistor used for absorbing regenerative
energy (i.e., models of 500 W or more), the average amount of regeneration Pr (unit: W) must be
calculated, and this value must be lower than the Servo Drive’s regenerative energy absorption
capacity. (The capacity depends on the model. For details, refer to Servo Drive Regenerative
Energy Absorption Capacity on page 4-48.)
The average regeneration power (Pr) is the regeneration power produced in one cycle of operation
[W].
t 1 t 2 t 3
T
E
g1
g3
Eg3
TD2
TL2
TD1
Eg2
Servomotor
operation
Servomotor
output torque
Rising
Falling
+N1
−N2
N1, N2: Rotation speed at beginning of deceleration [r/min]
T
D1, TD2: Deceleration torque [N·m]
T
L2: Torque when falling [N·m]
t
1, t3: Deceleration time [s]
t
2: Constant-velocity travel time when falling [s]
2Eg1Eg
=
Pr ( + ) / T [W]
T: O
eration c
cle
s
2Eg+

 Loading...