7 - 20 BeneVision N1 Patient Monitor Operator’s Manual
• QTc values are calculated based on the QT-HR, not the ECG HR. For more information, see
7.8.4Entering the QT View.
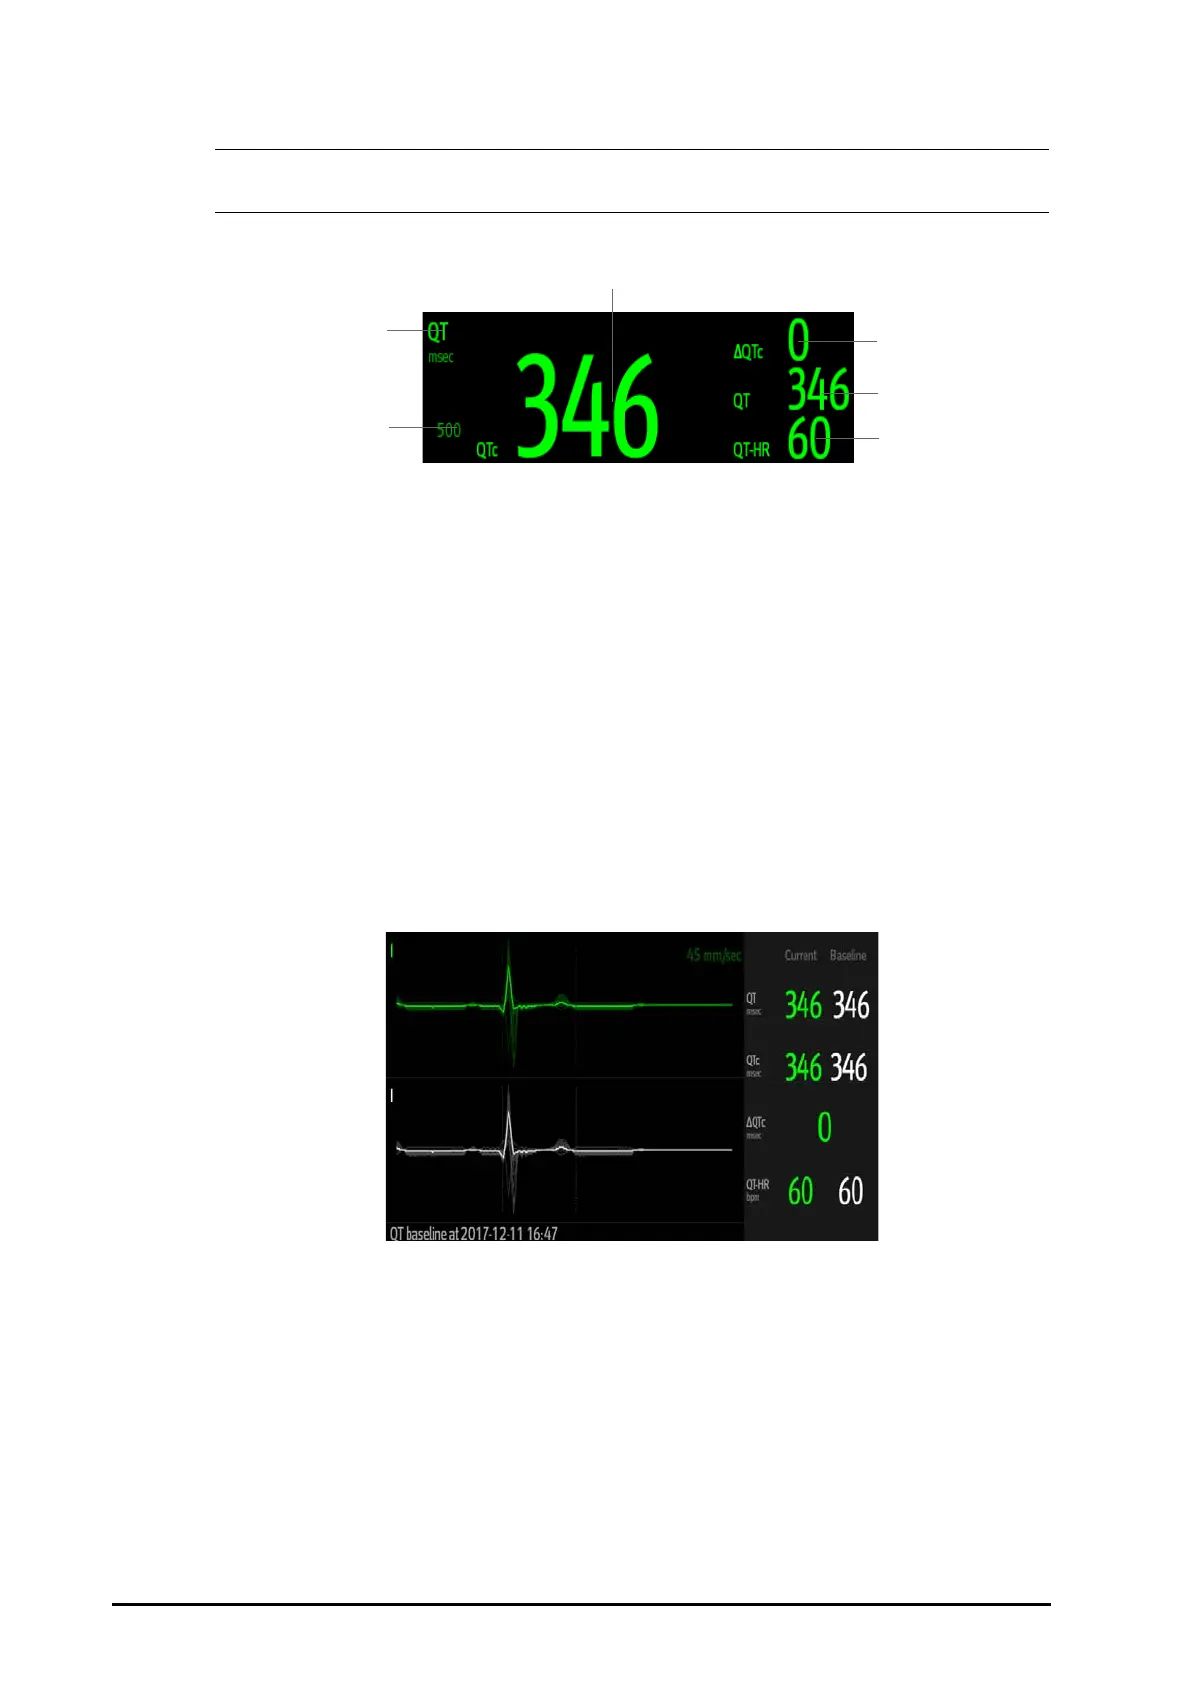
The following picture shows the QT numeric area. The monitor screen may look slightly different:
7.8.4 Entering the QT View
QT View shows the current and baseline QT parameter values and waveforms. To enter QT View, follow this
procedure:
1. Select the ECG numeric area or waveform area to enter the
ECG dialog.
2. Select the
QT tab.
3. Select
QT View.
The following picture shows a typical QT view.
■ The current waveform is shown in the upper half in green.
■ The baseline waveform is shown below in white.
■ The waveform of selected lead is highlighted, while the waveforms of other leads are in light green or light
gray.
■ The start of the QRS complex and the end of the T wave are marked with a vertical line.
■ In some conditions, no QT measurement can be made. Then the cause of failed QT measurement is shown
at the bottom of the QT numerics area and the message “Cannot Analyze QT” is shown in the technical
alarm area.
Select the left or right arrow to switch leads, and the corresponding waveform will be highlighted.
(1) QTc alarm limit (if QTc alarm is off, the alarm off symbol is displayed)
(2) Parameter label (3) QTc value
(4) QTc value (the difference between the current and baseline QTc values)
(5) QT value (6) QT-HR value
 Loading...