Setting up Compax3 C3I22T11
278 192-120114 N5 C3I22T11 June 2008
By clicking with the left mouse button on the legend, this can be shifted by 90°.
By clicking on the color bar, the color of the respective graph can be modified.
Cascade diagrams
Fre
uenc
Time scale
Color scale
By clicking with the left mouse button on the color scale, you can change between
autoscale mode and fixscale mode.
AutoScaleMode:
In this mode, the scaling of hte color scale is adapted automatically so that all va-
lues can be displayed.
FixScaleMode:
Here, the scaling is fixed.
=> If, for instance, a considerably higher value than before is to be displayed, it is
simply displayed like the former maximum (red).
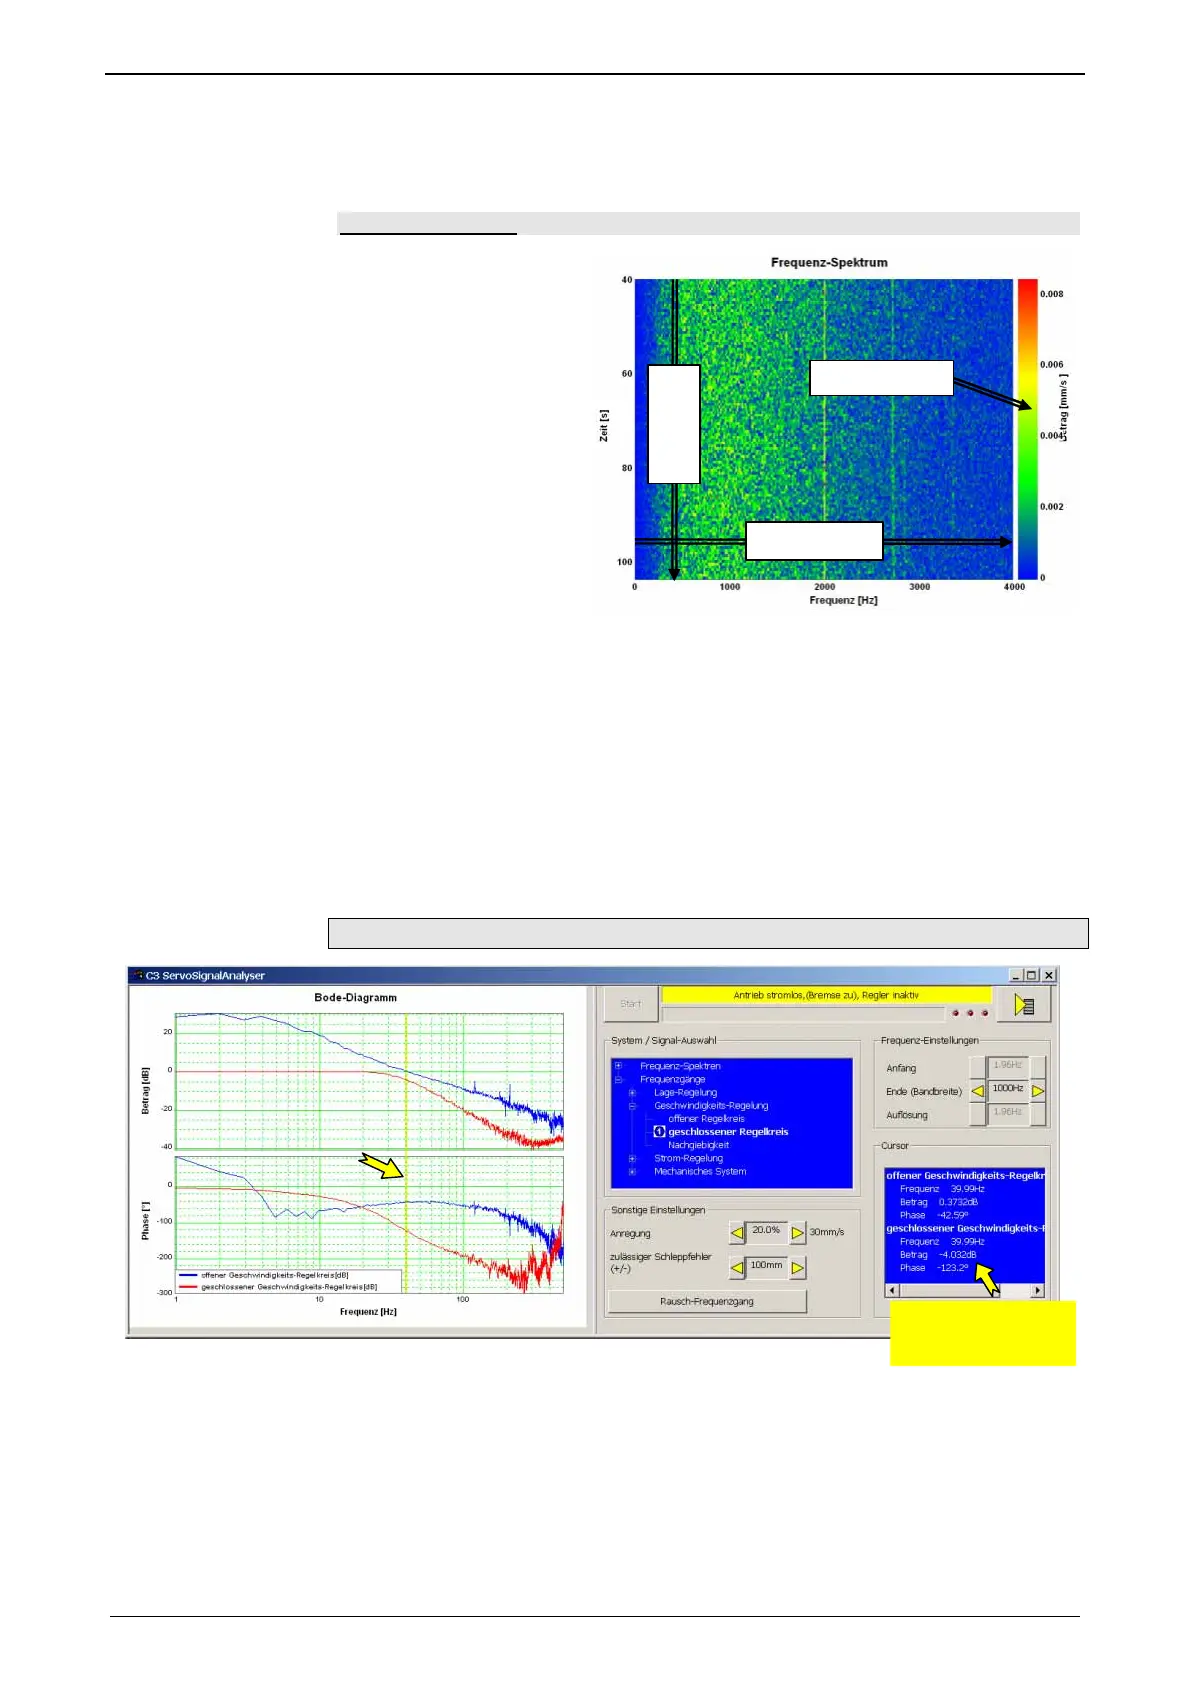
Dispaly of the measurement point at the cursor position
Cursor-Position
alues on the
Cursor-Position
The cursor is set by clicking on the left mouse button. All measurement data of the
selected cursor position (frequency) are displayed in the "cursor" operating field.
 Loading...