12. WEATHER
12-7
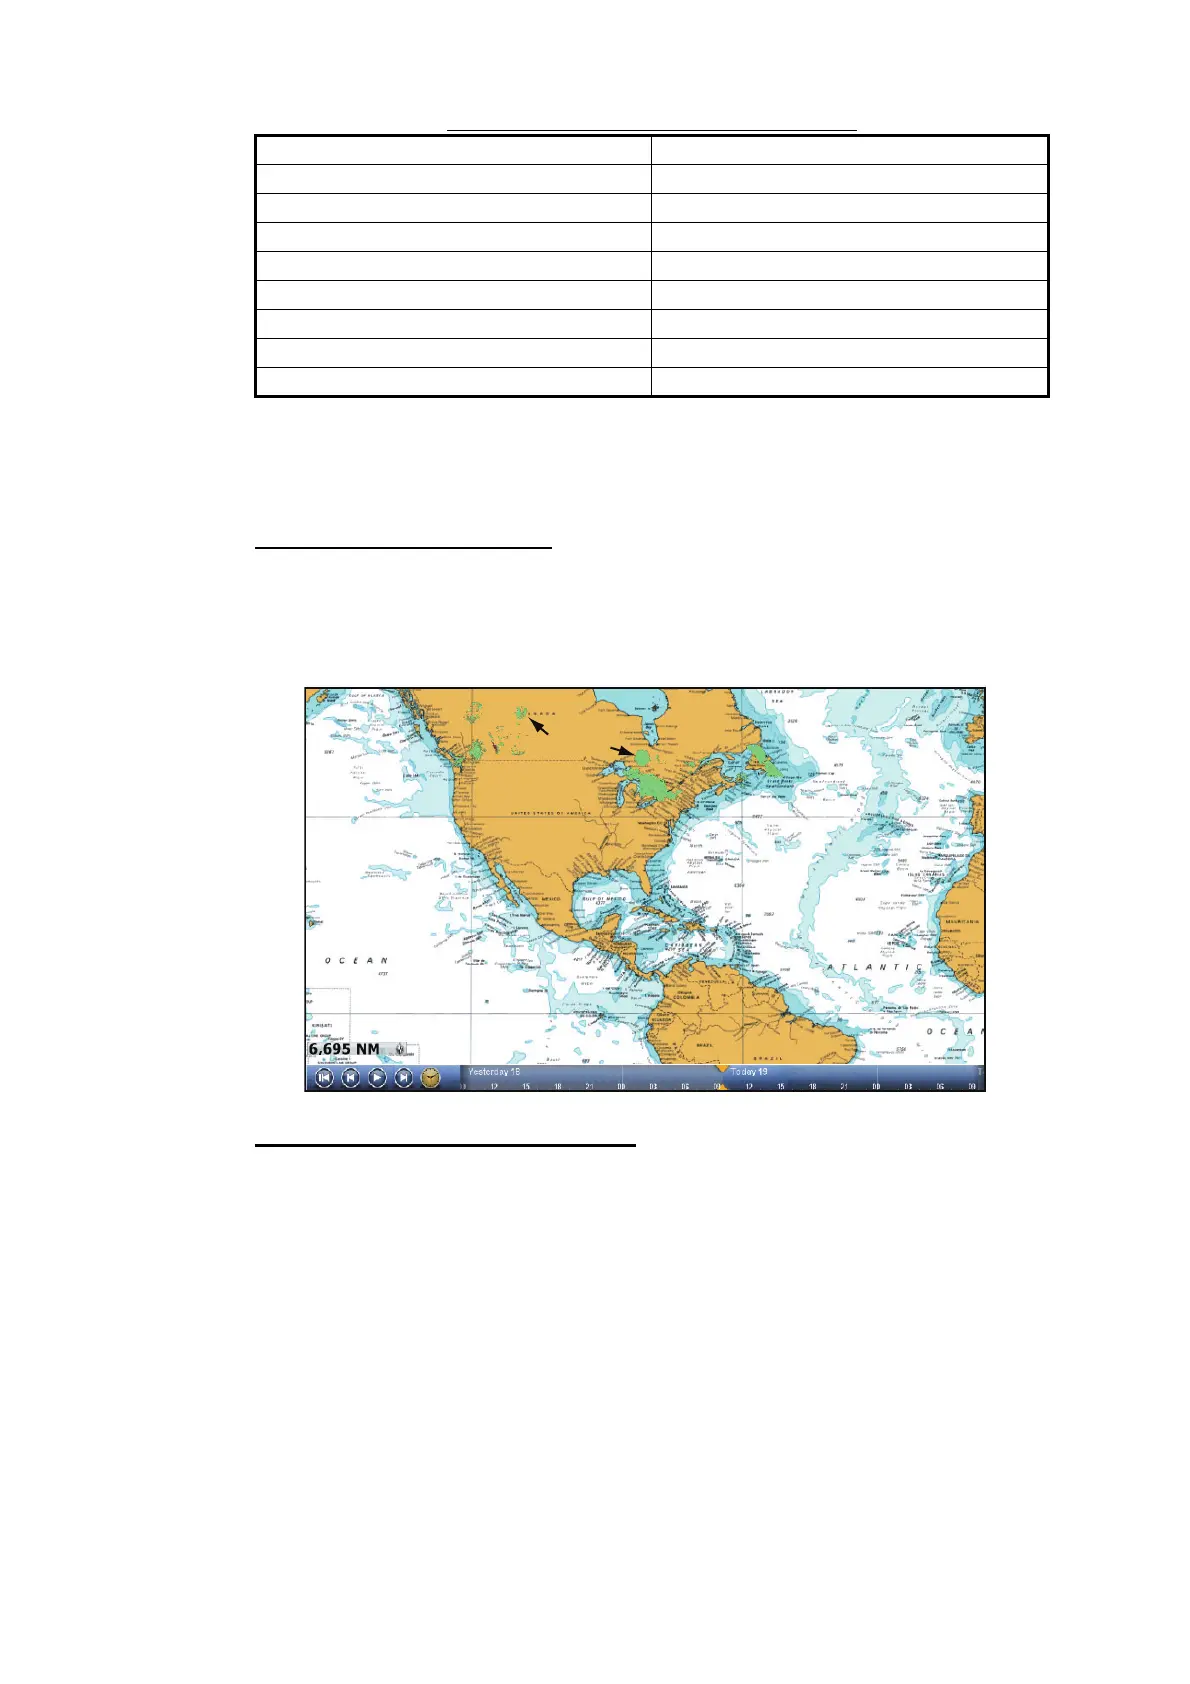
Precipitation indication on CanadianRadar
7. Select [Close] to exit the menu.
12.3.2 How to display the Sirius data
[Wx Radar] (Weather radar)
NOWRAD and Canadian weather radar information are put on your chart (see
paragraph 12.3.1). This display lets you see possible storm fronts to help you identify
the clouds from possible sea clutter. To display the weather radar, select [Wx Radar]
from the RotoKey menu.
[Adv Wx Data] (Advanced weather)
The advanced weather display provides the weather data; [Buoys], [City], [Storm],
[Lighting] or [Storm Tracks]. For the icons of these data, see section 12.4.
1. Select [Adv Wx Data] from the RotoKey menu.
2. Select a menu item to display its data.
Weather radar color Level (mm per hour)
Transparent (low precipitation) 0.00 to 0.20 mm/hr
Light green 0.21 to 1.00 mm/hr
Medium green 1.01 to 4.00 mm/hr
Dark green 4.01 to 12.00 mm/hr
Yellow 12.01 to 24.00 mm/hr
Orange 24.01 to 50.00 mm/hr
Light red 50.01 to 100 mm/hr
Dark red over 100.01 mm/hr
Wx radar
display
 Loading...