2. CHART PLOTTER
2-2
2.2 Chart Scale
You can change the chart scale to change the amount of information shown, or zoom
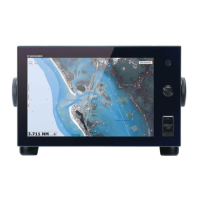
in or out at the location you select. The selected chart scale appears in the chart scale
box at the bottom right-hand corner of the screen. The value shown is the distance
from the left of the screen to the right of the screen.
How to zoom in or out the chart scale
TZT9/TZT14: Rotate the RotoKey
TM
or pinch the chart screen.
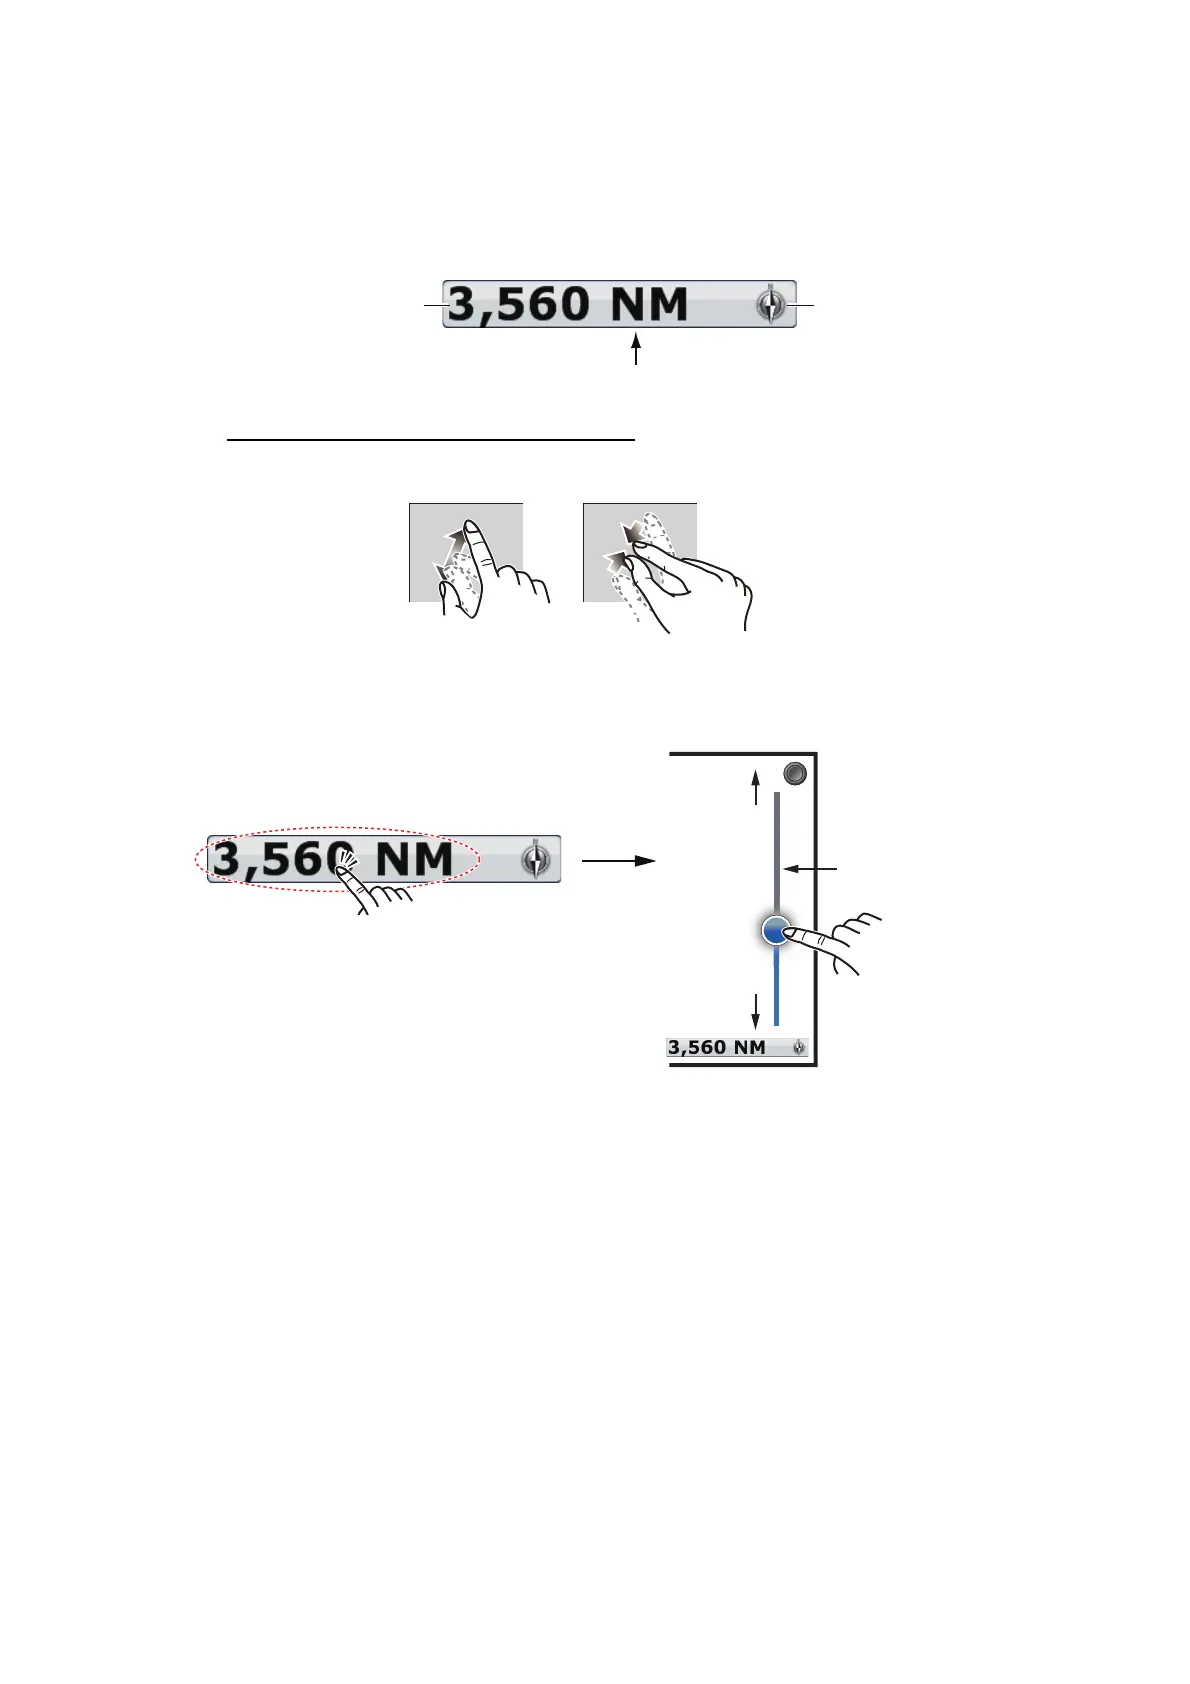
TZTBB: Pinch the chart screen. Or tap the chart scale box at the bottom right-hand
corner of the screen to display the slider bar. Drag the circle icon to set the chart scale.
Note 1: You can judge the suitability of the range by the color of the chart scale indi-
cation.
Black: Range is appropriate for chart accuracy.
Red: Range is inappropriate for chart accuracy. If you continue zooming in, the chart
is not displayed and the background of the screen turns gray.
Note 2: You can zoom in or out the chart scale on the preview screen.
2.3 Orientation Mode
The chart can be shown in head-up or north-up orientation.
1. Select [Orientation] from the RotoKey menu.
2. Select [North Up] or [Head Up].
[North Up]: North is at the top of the screen. When your heading changes, the boat
icon moves according to heading. This mode is for long-range navigation.
Chart scale
Chart scale box
North indicator
Tap the area circled above to display the
slider bar.
Note: The orientation mode can be changed
by tapping the north indicator (see section
2.3).
Drag the circle
icon to set the
chart scale.
Slider bar
Zoom in
Zoom out
 Loading...