3. 3D DISPLAY, OVERLAYS
3-3
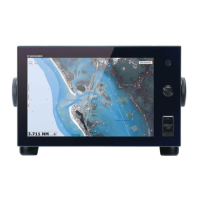
High gives the highest level of exaggeration. The example below compares the
same picture in low and high exaggerations.
4. Select [Close] to exit the menu.
3.2 Overlays
Radar, satellite photo, depth shading, tide icons, tidal currents, etc. overlays are avail-
able on the chart plotter display.
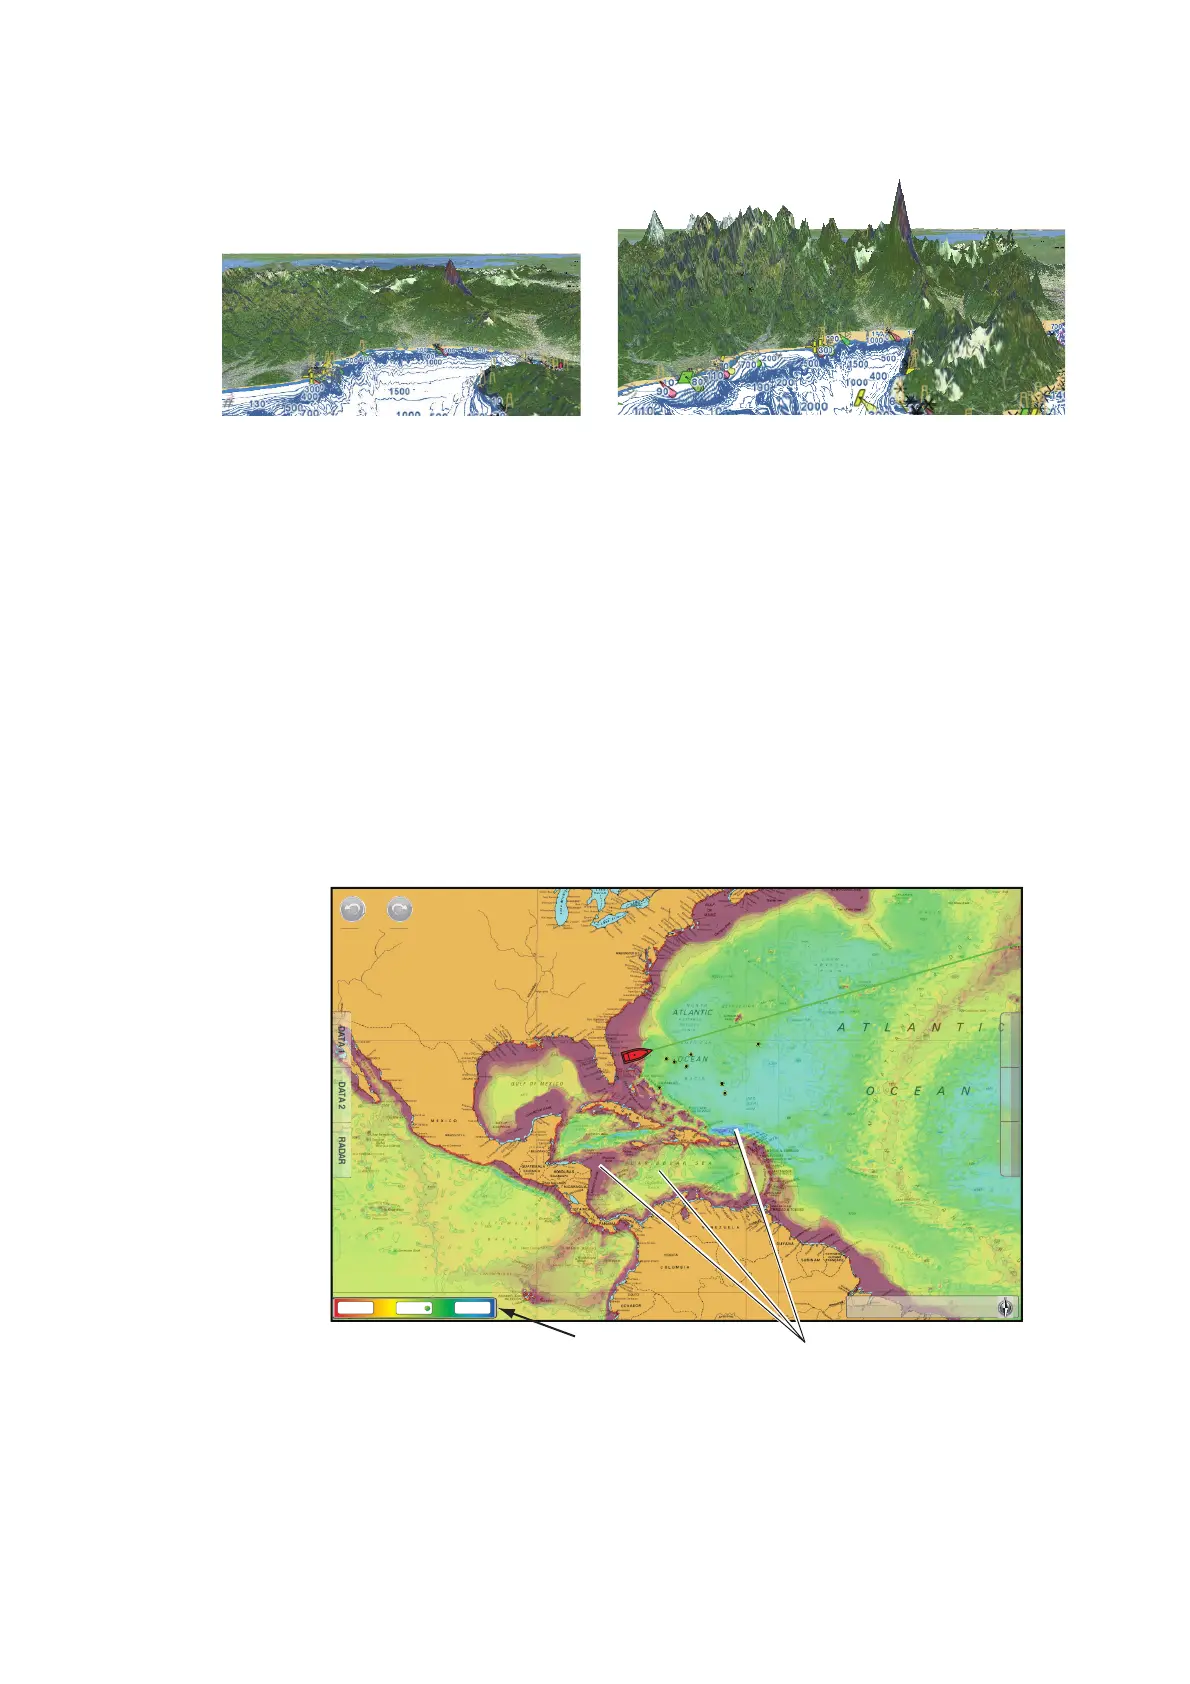
3.2.1 Depth shading overlay
The depth shading overlay shows the depths in different color (the default settings are
red (shallow), yellow (medium) and blue (deep)). This overlay is available in both 2D
and 3D presentations. Use this overlay to find depths. To show the depth shading
overlay, select [Overlay] from the RotoKey menu then select [Dpth Shade]. To hide
the depth shading overlay, deselect [Dpth Shade].
High exaggeration
Low exaggeration
Depth shading
Depth shading color scale
RADAR DATA 2 DATA 1
4,791 NM
0.0 ft
950 ft
Auto
 Loading...