3. 3D DISPLAY, OVERLAYS
3-9
How to understand the tide graph
• Vertical axis: Height, Horizontal axis: Time
• The information is mostly accurate under moderate weather conditions. However,
storms and weather fronts can influence forecasted tide times and heights.
• Drag the time scale at the bottom of the screen sideways then read the tide height
at the selected time (drag to the left to display the future information, right for the
past information).
• To set the time scale to the current time, select the clock mark at the bottom left-
hand corner of the screen. The color of the clock mark turns gold.
• To return to the chart plotter display, select [Close] at the top right-hand corner of
the screen.
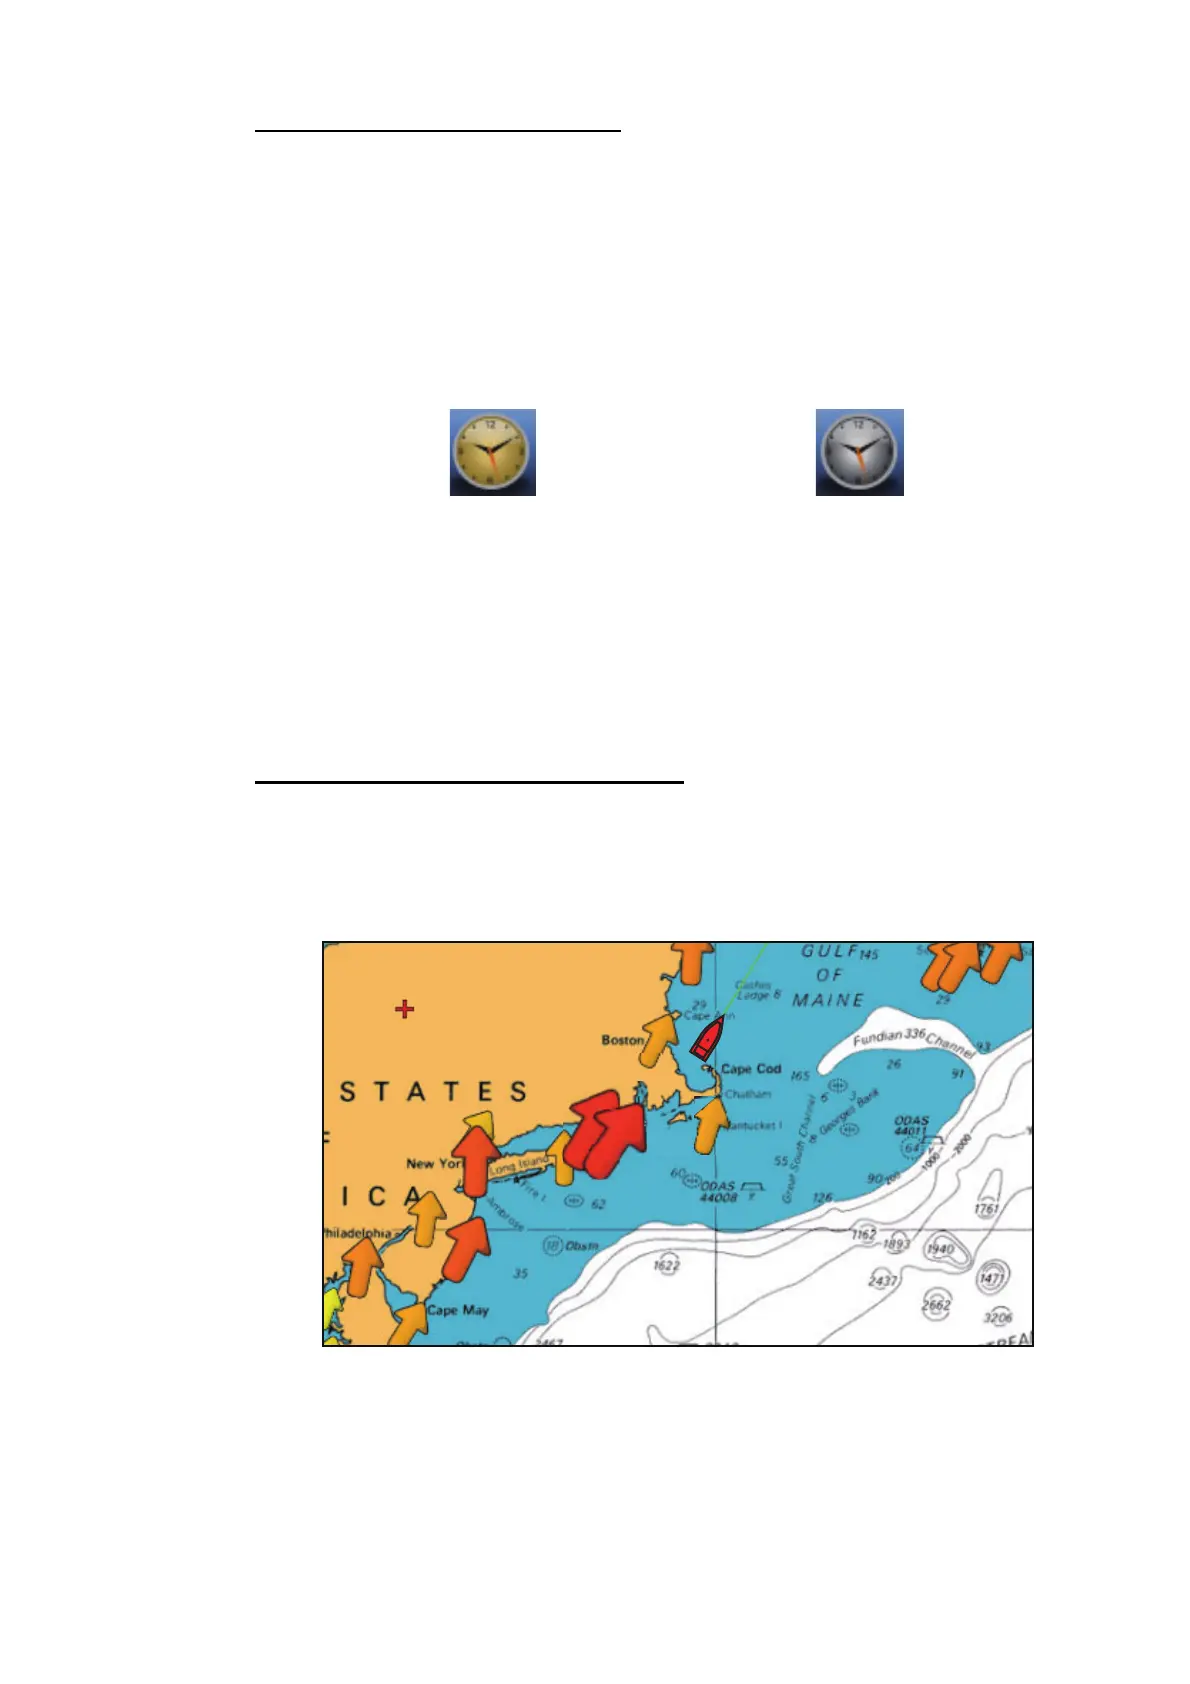
3.2.5 Tidal current overlay
The tidal current overlay is made from the tidal current data received from NOAA sat-
ellites, available in North America.
How to display the tidal current overlay
1. Select [Overlay] from the RotoKey menu.
2. Select [Currents].
Arrows of more than one color and size appear on the screen and are pointing in
different directions.
The arrow indicates the movement of the tidal current. The size and color of the arrow
indicate the tidal current speed (yellow: slow, orange: medium, red: fast).
Clock mark for the current time
Clock mark except the current time
 Loading...