Click the Apply button to accept the changes made for each individual section.
Statistics
Port Statistics
Packets
The Web manager allows various packet statistics to be viewed as either a line graph or a table. Six windows are
offered.
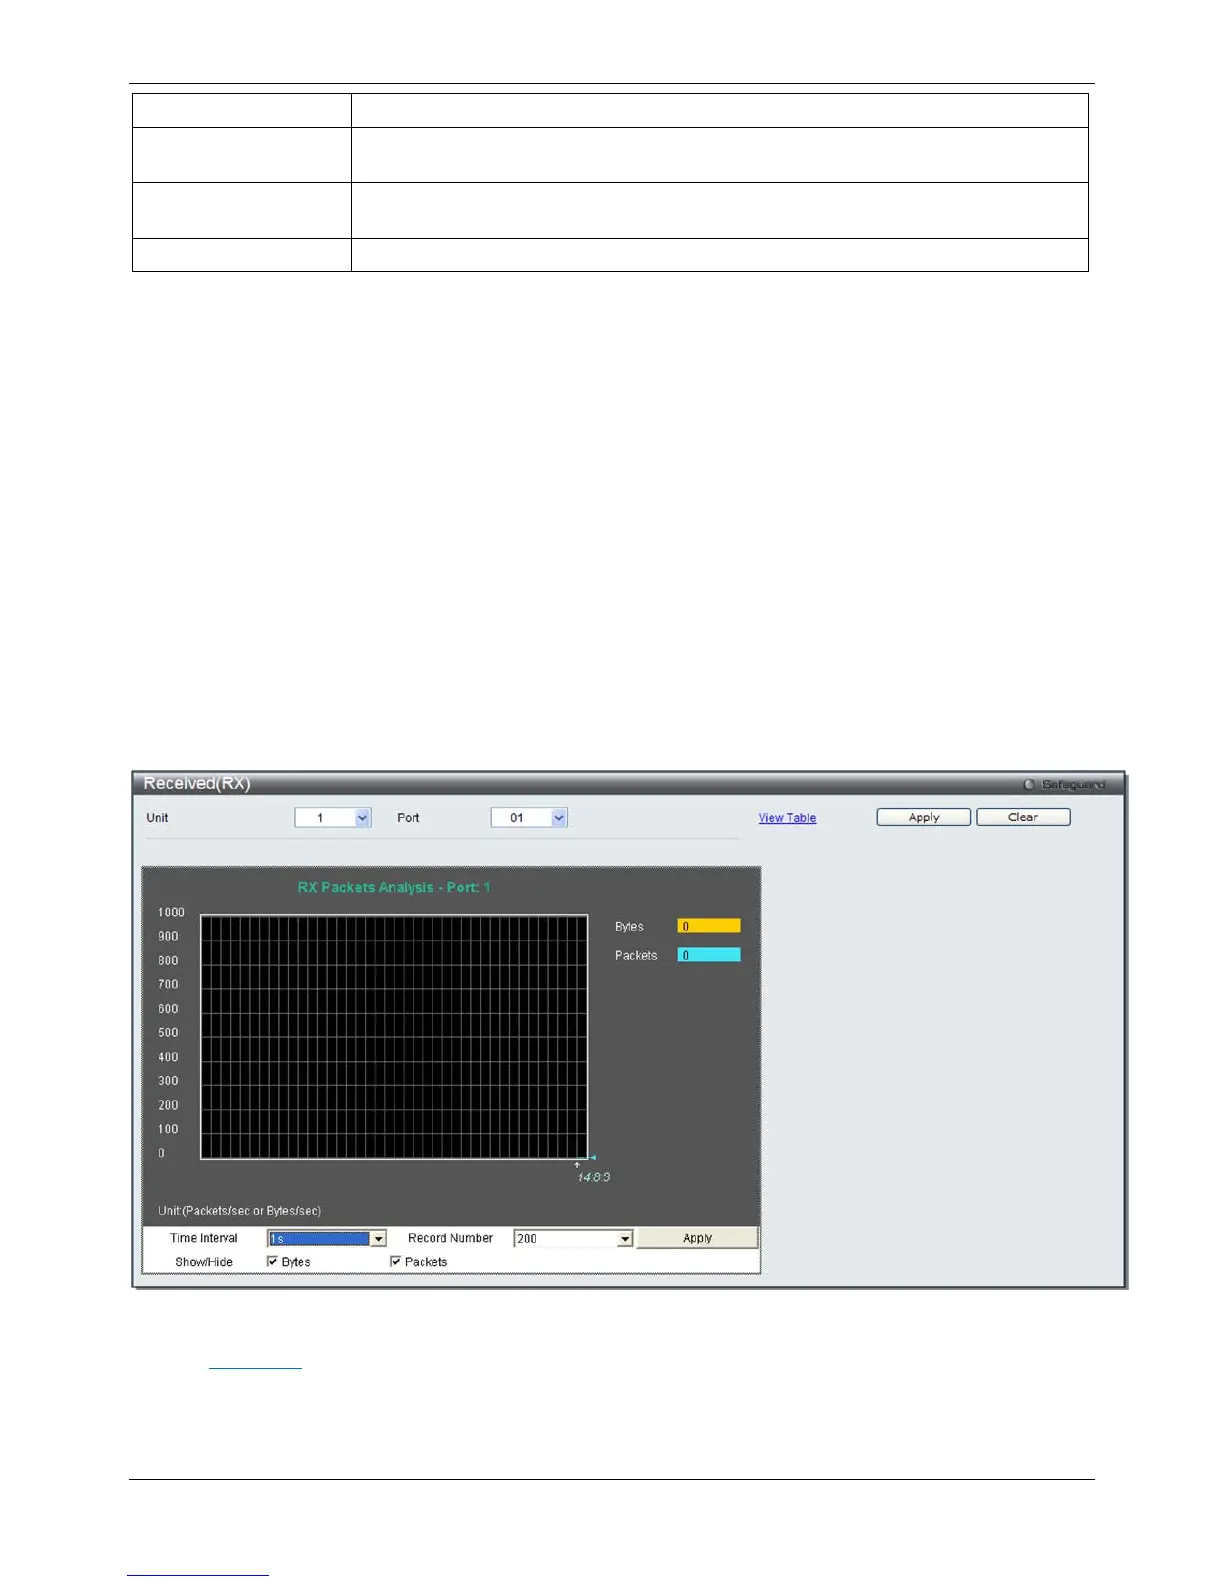
Received (RX)
To select a port to view these statistics for, select the port by using the Port drop-down menu. The user may also
use the real-time graphic of the Switch at the top of the web page by simply clicking on a port.
To view this window, click Monitoring > Statistics > Port Statistics > Packets > Received (RX) as shown below:
Figure 11-4 Received (RX) window (for Bytes and Packets)
Click the
View Table link to display the information in a table rather than a line graph.
 Loading...