8. HOW TO CONTROL CHART OBJECTS
8-10
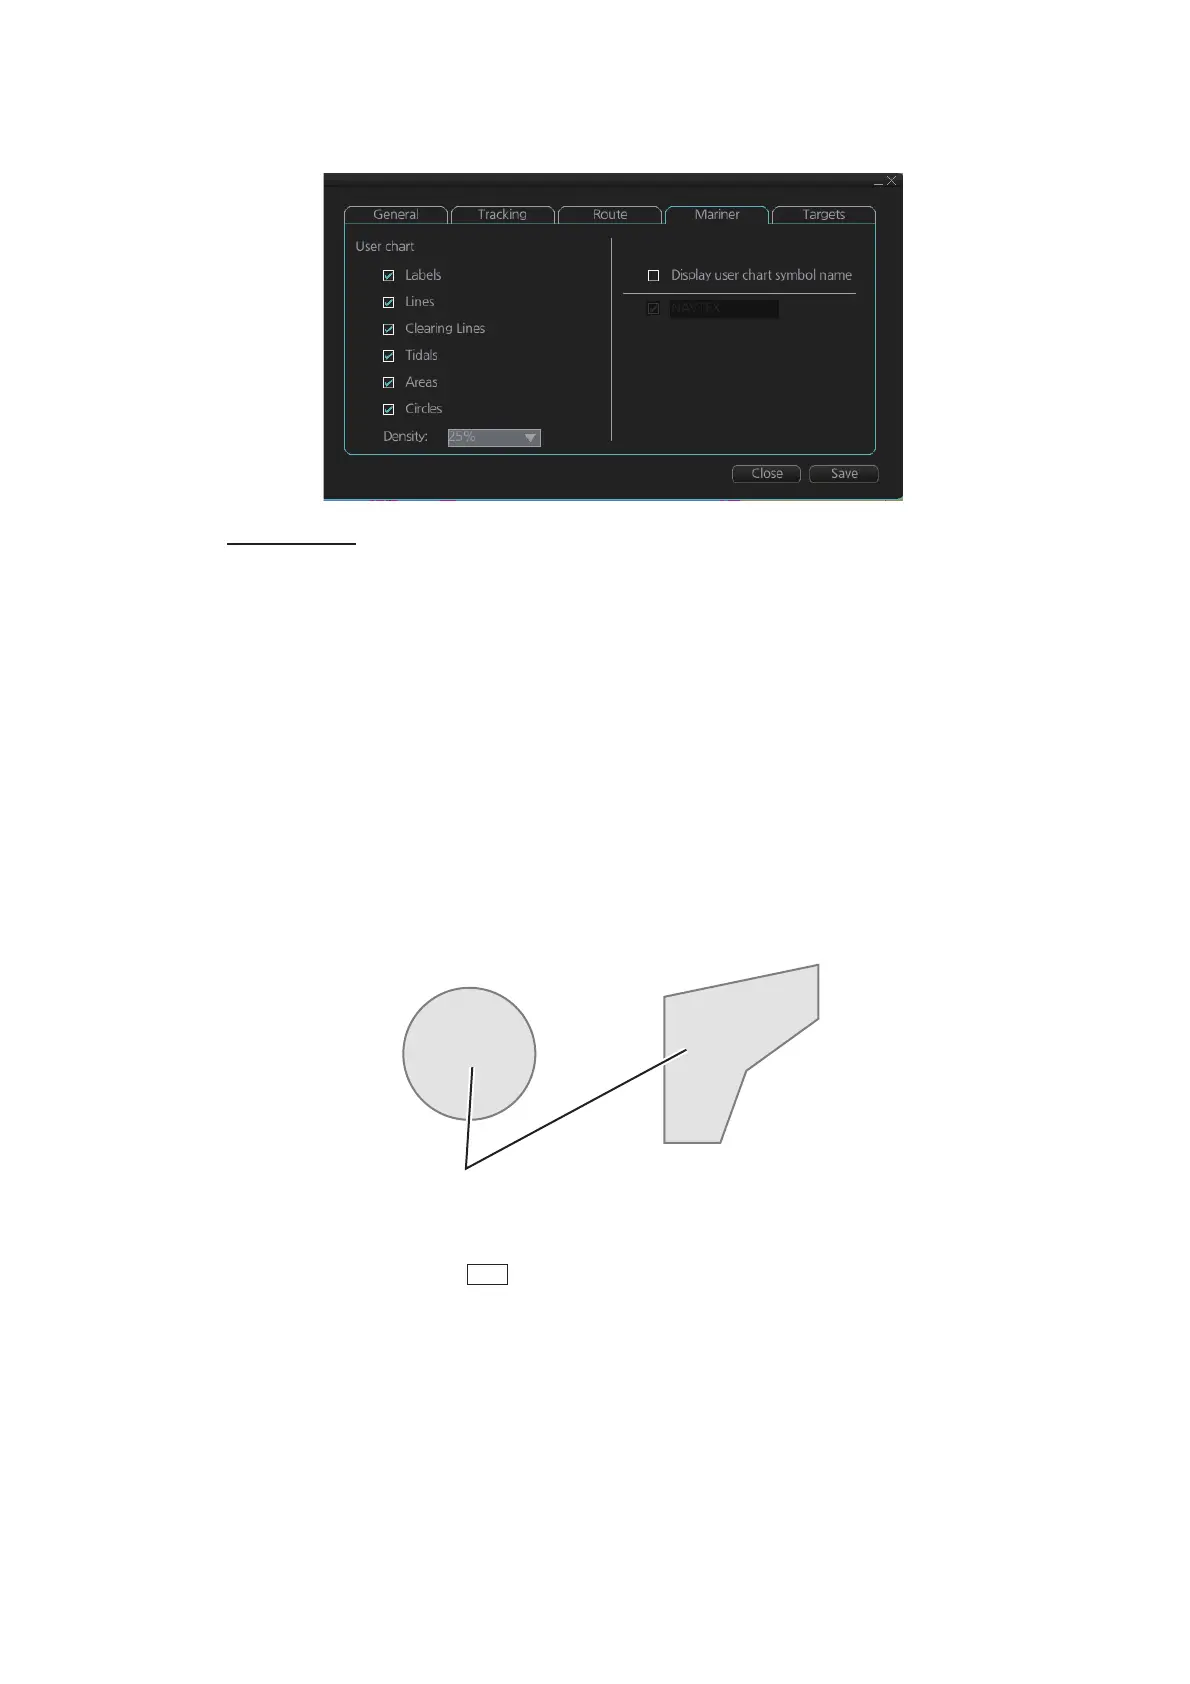
8.3.4 Mariner page
[User chart]
[Labels]: Check to show labels on user charts.
[Lines]: Check to show lines on user charts.
[Clearing Lines]: Check to show clearing lines (for marking dangerous areas) on user
charts.
[Tidals]: Check to show symbols and tidals on user charts.
[Areas]: Check to show areas on the user charts.
[Circles]: Check to show circles on user charts.
[Density]: Set the degree of transparency for the user chart objects. Color fill for the
areas can be selected as transparent from 25%, 50%, 75% and as [No color fill]. If [No
color fill] is selected, only the boundaries of the areas are visible.
[Display user chart symbol name]: Check to display the name entered for a user chart
symbol in the [Name] column of the [User Chart] dialog box. Effective for the circle and
area symbols only. Names are shown in both the Voyage planning and Voyage navi-
gation modes. See the figure below for examples.
[NAVTEX]: Available only when a Navtex receiver is enabled at installation. Check to
put the Navtex symbol ( ) at the coordinates received in a Navtex message. De-
pending on the information received, the symbols appears as shown in the figure on
the following page.
Wreck
Reef
Name as entered in [Name] column.
 Loading...