v 1.0 — February 2020 Altanium Matrix5
90 Temperature Graphs Screen
To see the cross-talk information, do the steps that follow:
1. On the Test Results screen, select the zones to compare.
NOTE: A maximum of 10 zones at a time can be selected and compared.
2. Touch the Cross-Talk button.
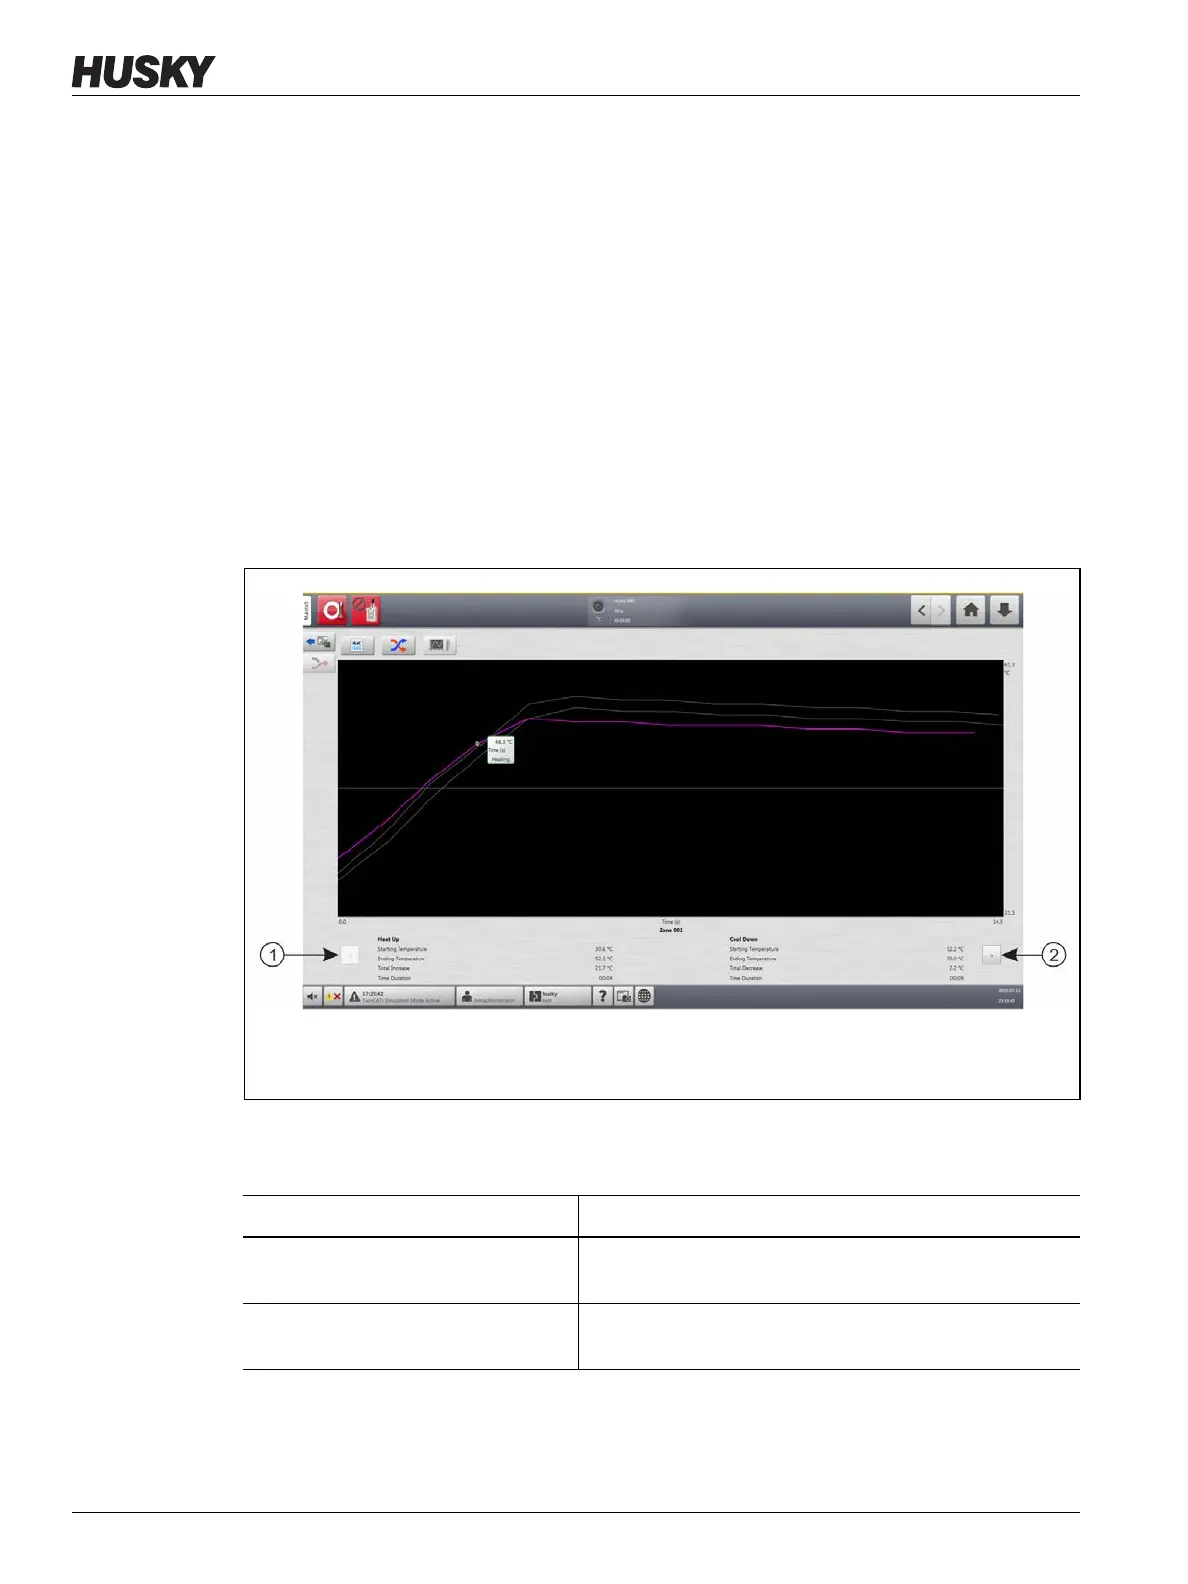
8.4 Temperature Graphs Screen
The Temperature Graphs screen has a graphical trace for each zone that shows the
temperature rise during the full test. Refer to Figure 8-4.
To open the Temperature Graphs screen, touch the Temperature Graphs button on the Test
Results screen.
The Temperature Graphs screen buttons are described in Table 8-5.
The Heat Up and Cool Down indications for the Temperature Graphs screen are described in
Table 8-6.
Figure 8-4 Temperature Graphs Screen
1. Previous Button 2. Next Button
Table 8-5 Temperature Graphs Screen Button Descriptions
Button Description
Previous Arrow Shows the results of the previous zone if multiple zones are
selected.
Next Arrow Shows the results of the next zone if multiple zones are
selected.
 Loading...