v 1.0 — February 2020 Altanium Matrix5
56 Graphical View Screen Overview
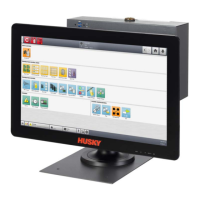
3. Touch the Accept button.
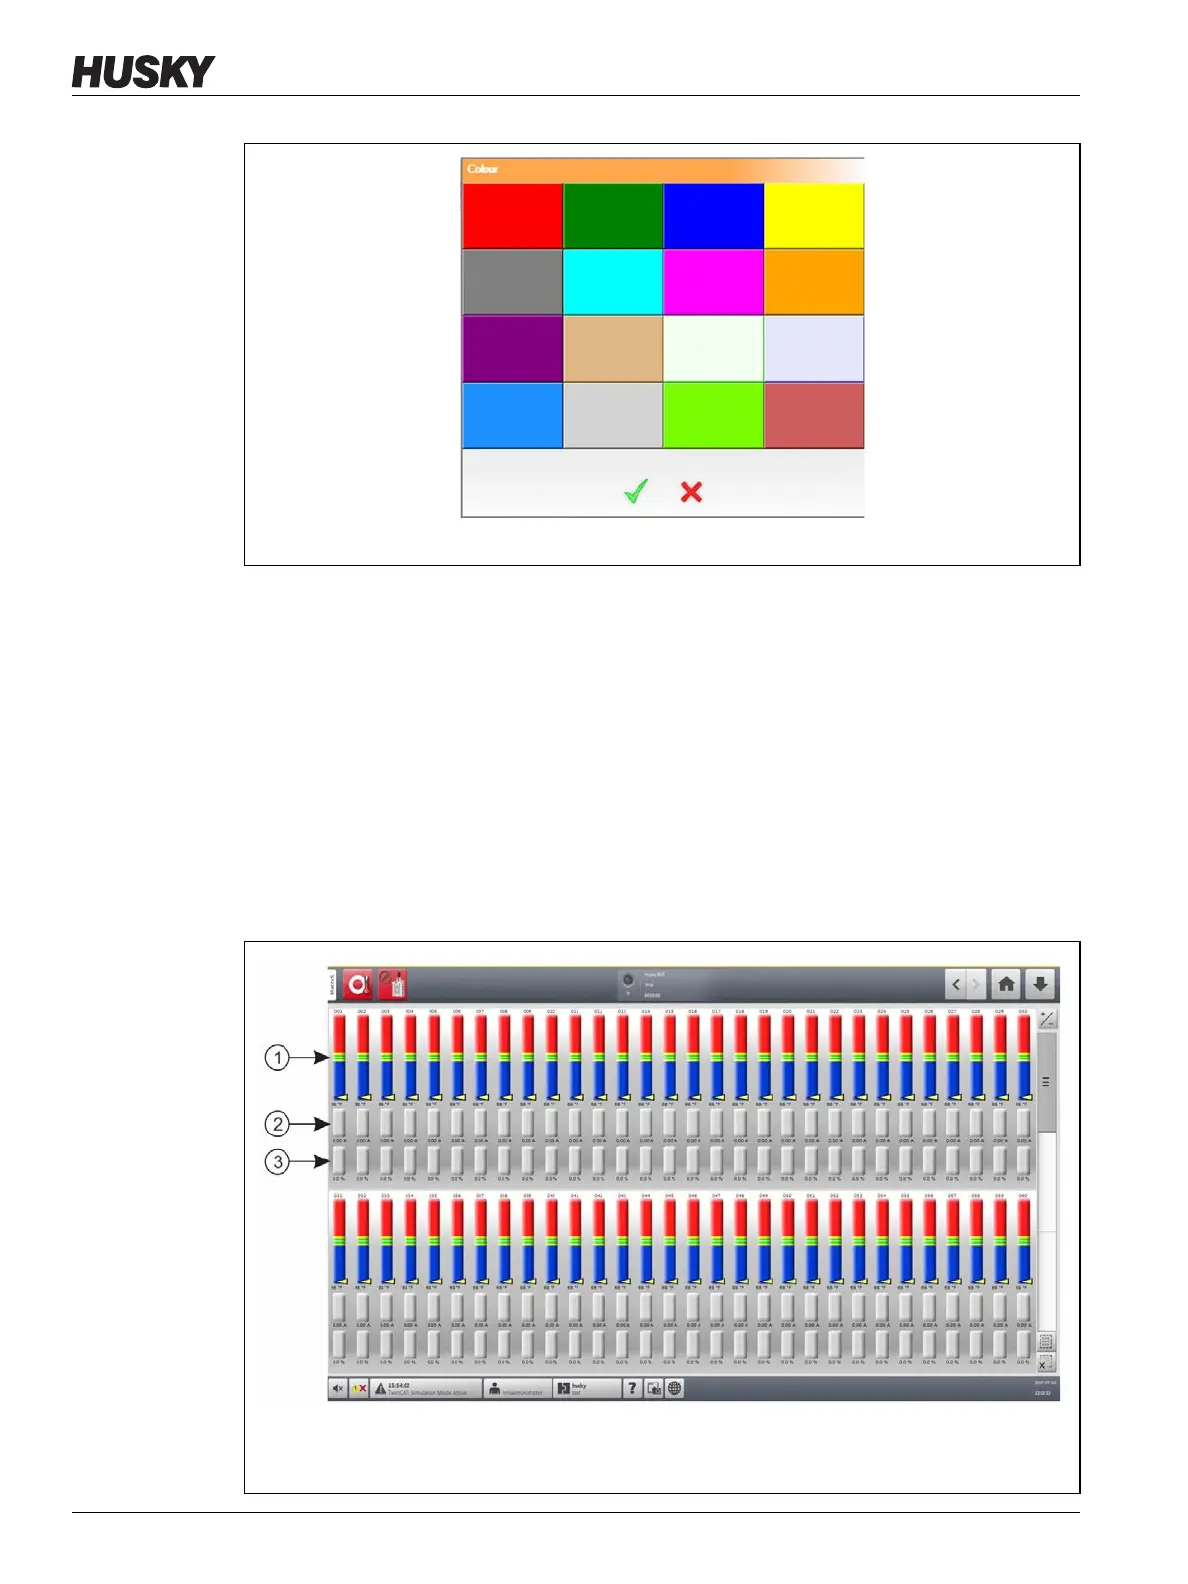
7.4 Graphical View Screen Overview
The Graphical View displays zones in a graphical format. This view is an easy way to see the
overall status of the mold and not have to sort through detailed data. Figure 7-5 shows the
Graphical View screen in split screen mode. Table 7-2 gives the descriptions for the bars
shown on the Graphical View screen.
Touch the Graphical View button on the Home screen.
Figure 7-4 Color Change Dialog Box
Figure 7-5 Graphical View Screen - Full Screen Mode
1. Zone Bars 2. Amperage Bars 3. Power Bars
 Loading...