History Plot Screen 159
User Guide v 1.0 — February 2020 Data Recording
5. Touch the process variable you want to see.
6. Touch the Accept button.
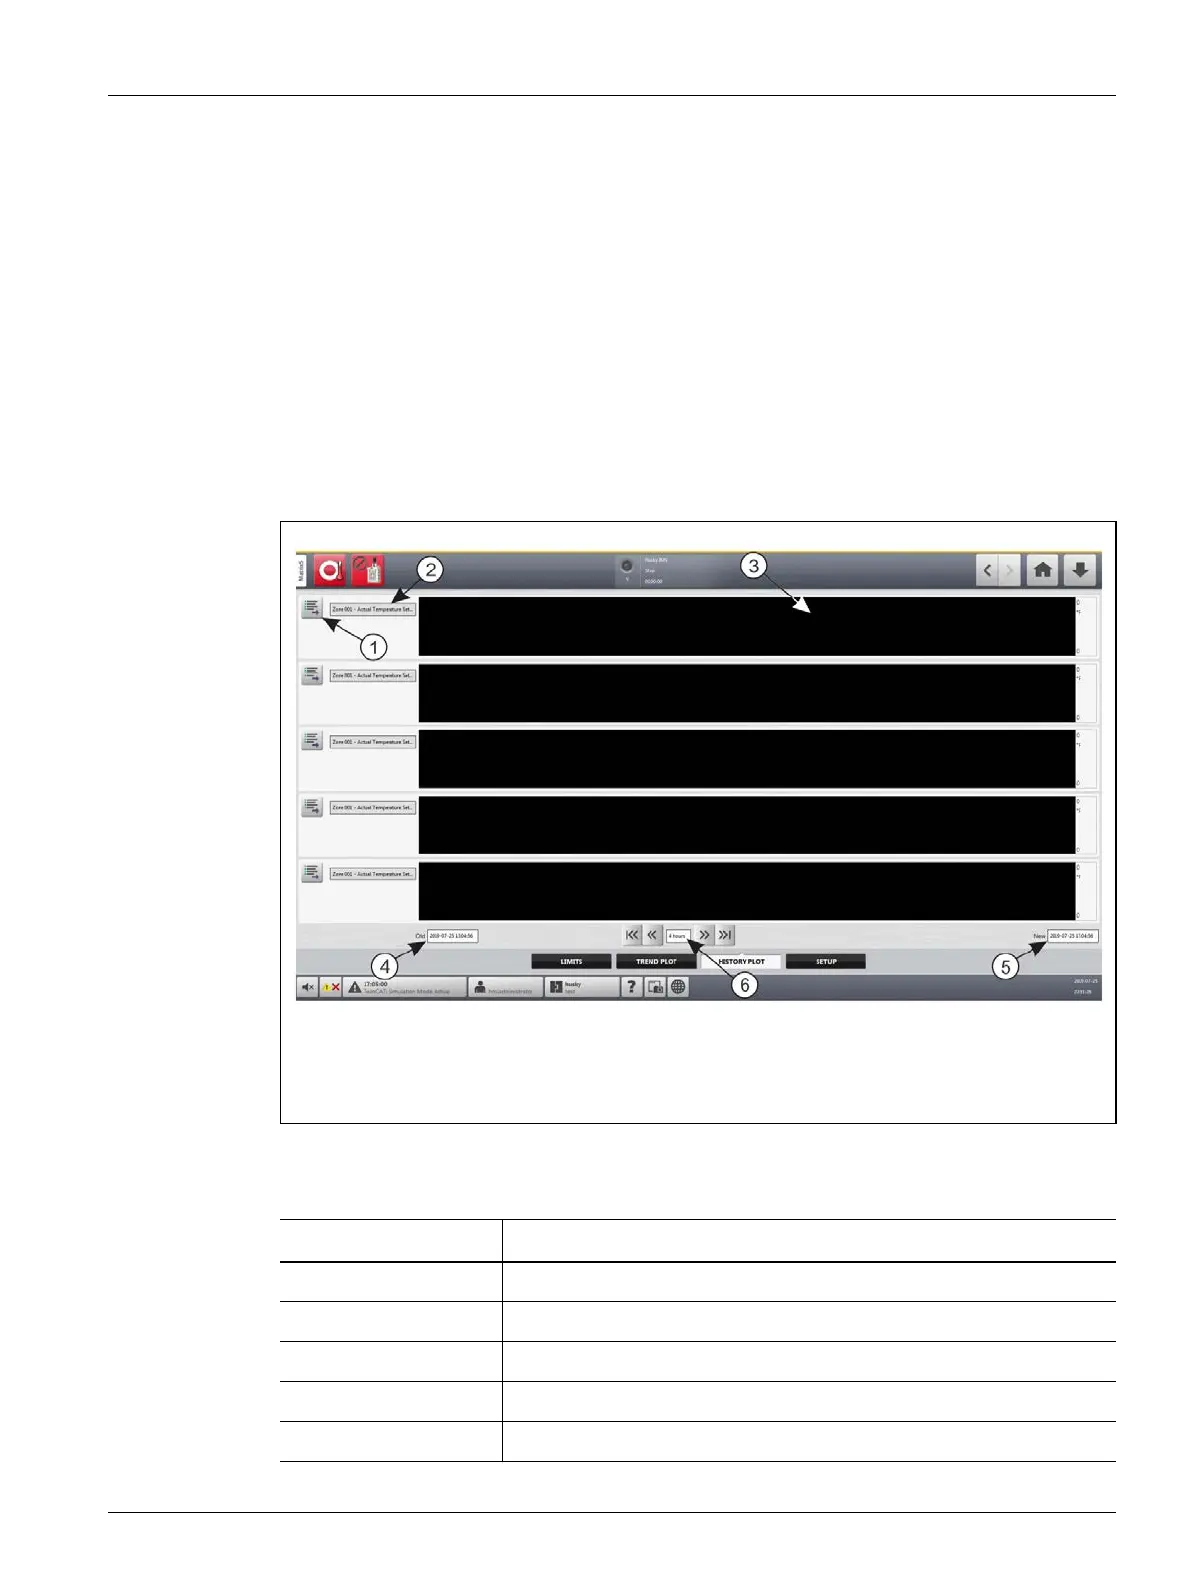
12.2 History Plot Screen
The History Plot screen gives a visual summary of the recorded operation that shows power
usage, temperature fluctuations, setpoint values, pressures, positions, and times. A detailed
textual representation is offered for specific times. Data is shown zone by zone.
To see the History Plot screen, touch the Process Monitoring button on the Home screen
and then touch the History Plot tab. Refer to Figure 12-3.
Items on the History Plot screen are described in Table 12-1.
Figure 12-3 History Plot Screen
1. Variable Selection Button 2. Process Variable 3. Graph Section 4. Date and Time Range -
Old 5. Date and Time Range - New 6. Timeframe
Table 12-1 Process History Screen Item Descriptions
Item Description
Process Variable The process variable shown in the process history.
Graph Section The operation history of one zone.
Timeframe The period of time shown on the graphs.
Date Range Old The oldest date shown on the graph.
Date Range New The newest date shown on the graph.
 Loading...