Rockwell Automation Publication 1783-UM007G-EN-P - February 2017 395
Monitor the Switch Chapter 8
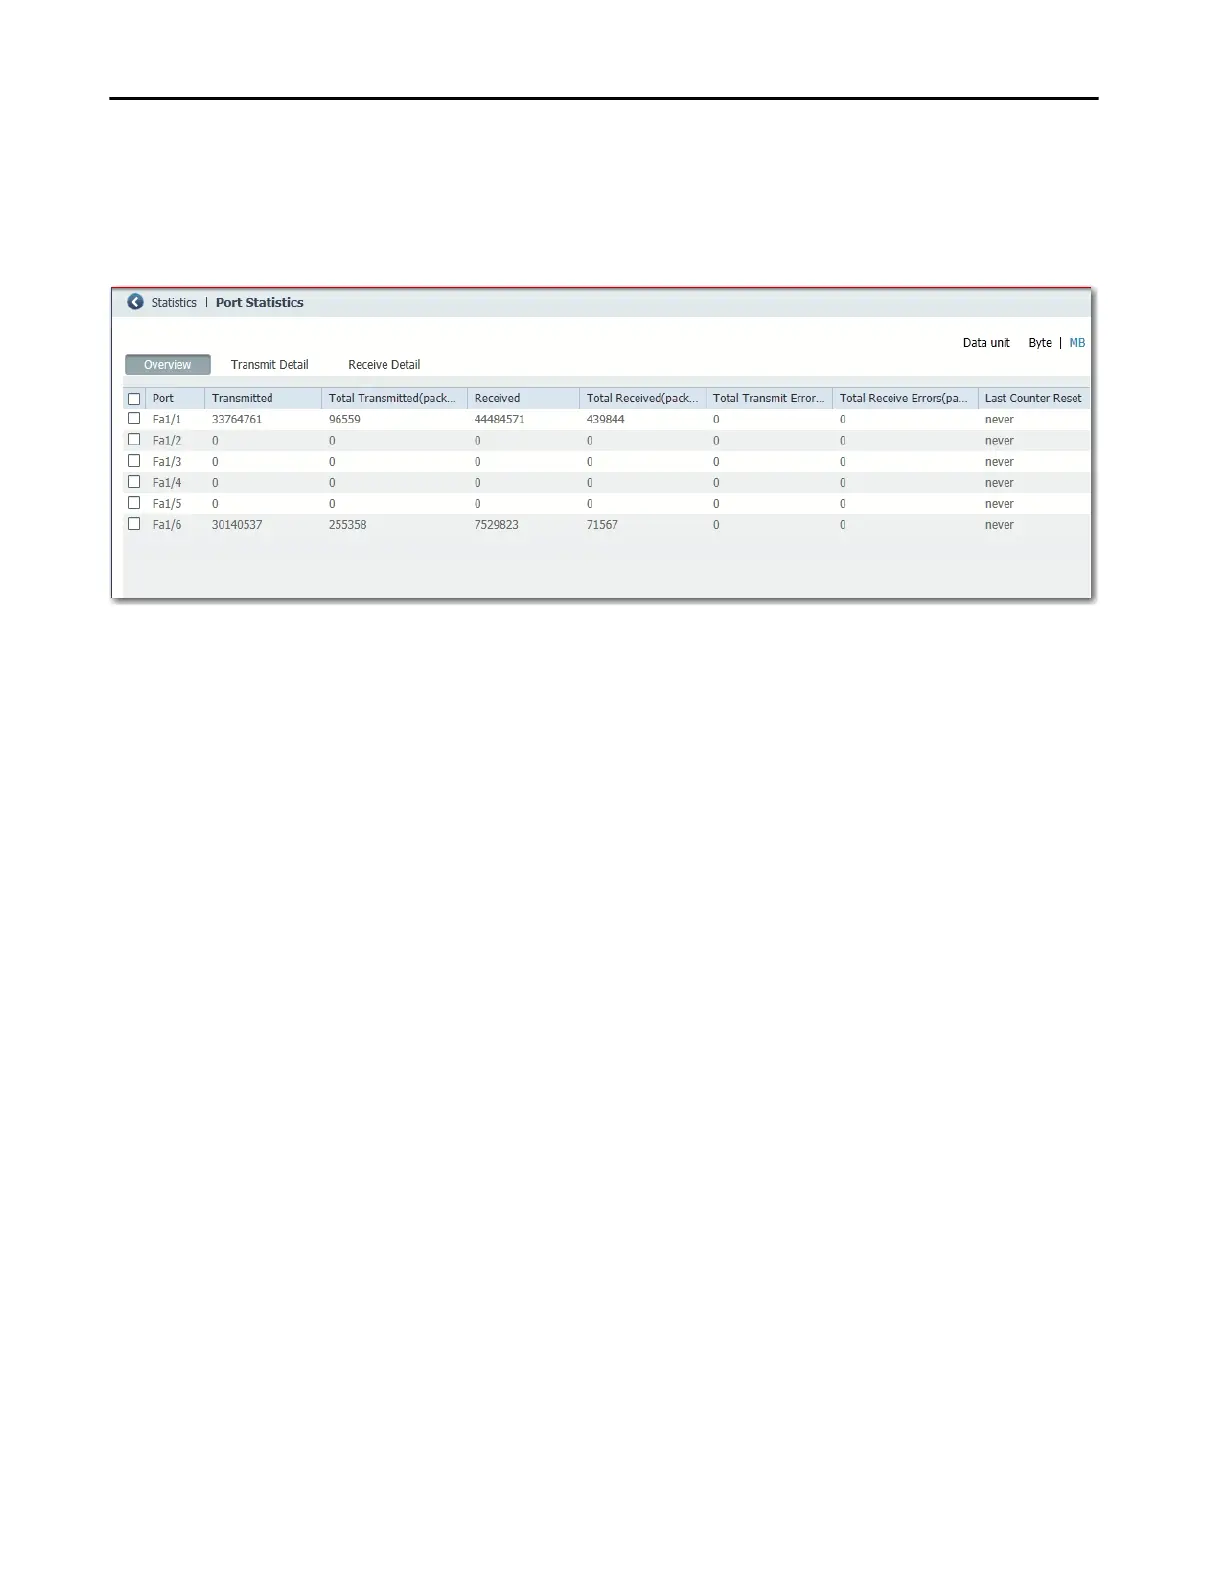
Port Statistics
In Device Manager, you can view statistics for data that passes through the
switch ports.
From the Monitor menu, choose Port Statistics. For more information, see the
online help for Device Manager.
The types of port statistics are grouped under these tabs on the Port Statistics
window:
• Overview tab—Use this tab to display the number of error packets that
is received and sent from the port. This level of detail is not available
from the Dashboard graphs.
The number of error packets can mean a duplex mismatch,
incompatibilities with the port and its attached device, or faulty cables
or attached devices. Any of these problems can cause slow network
performance, data loss, or lack of connectivity.
• Transmit Detail tab—Use this tab to troubleshoot unusual changes in
network traffic. This tab displays these statistics:
– Unicast, multicast, and broadcast packets that are sent from each port
– Detailed statistics of errors that are sent to each port
If a port is sending an unusually high amount of traffic, such as multicast
or broadcast packets, monitor the connected device to see whether the
traffic pattern is normal.
• Receive Detail tab—Use this tab to troubleshoot unusual changes in
network traffic. This tab displays these statistics:
– Unicast, multicast, and broadcast packets that are received on each
port
– Detailed statistics of errors that are received on each port
If a port is receiving an unusually high amount of traffic, such as
multicast or broadcast packets, monitor the connected device to see
whether the traffic pattern is normal.
 Loading...