Note: This page is available only if the SBC application has been enabled.
To view average call duration:
1. Open the Average Call Duration page (Status & Diagnostics tab > Performance
Monitoring menu > Average Call Duration).
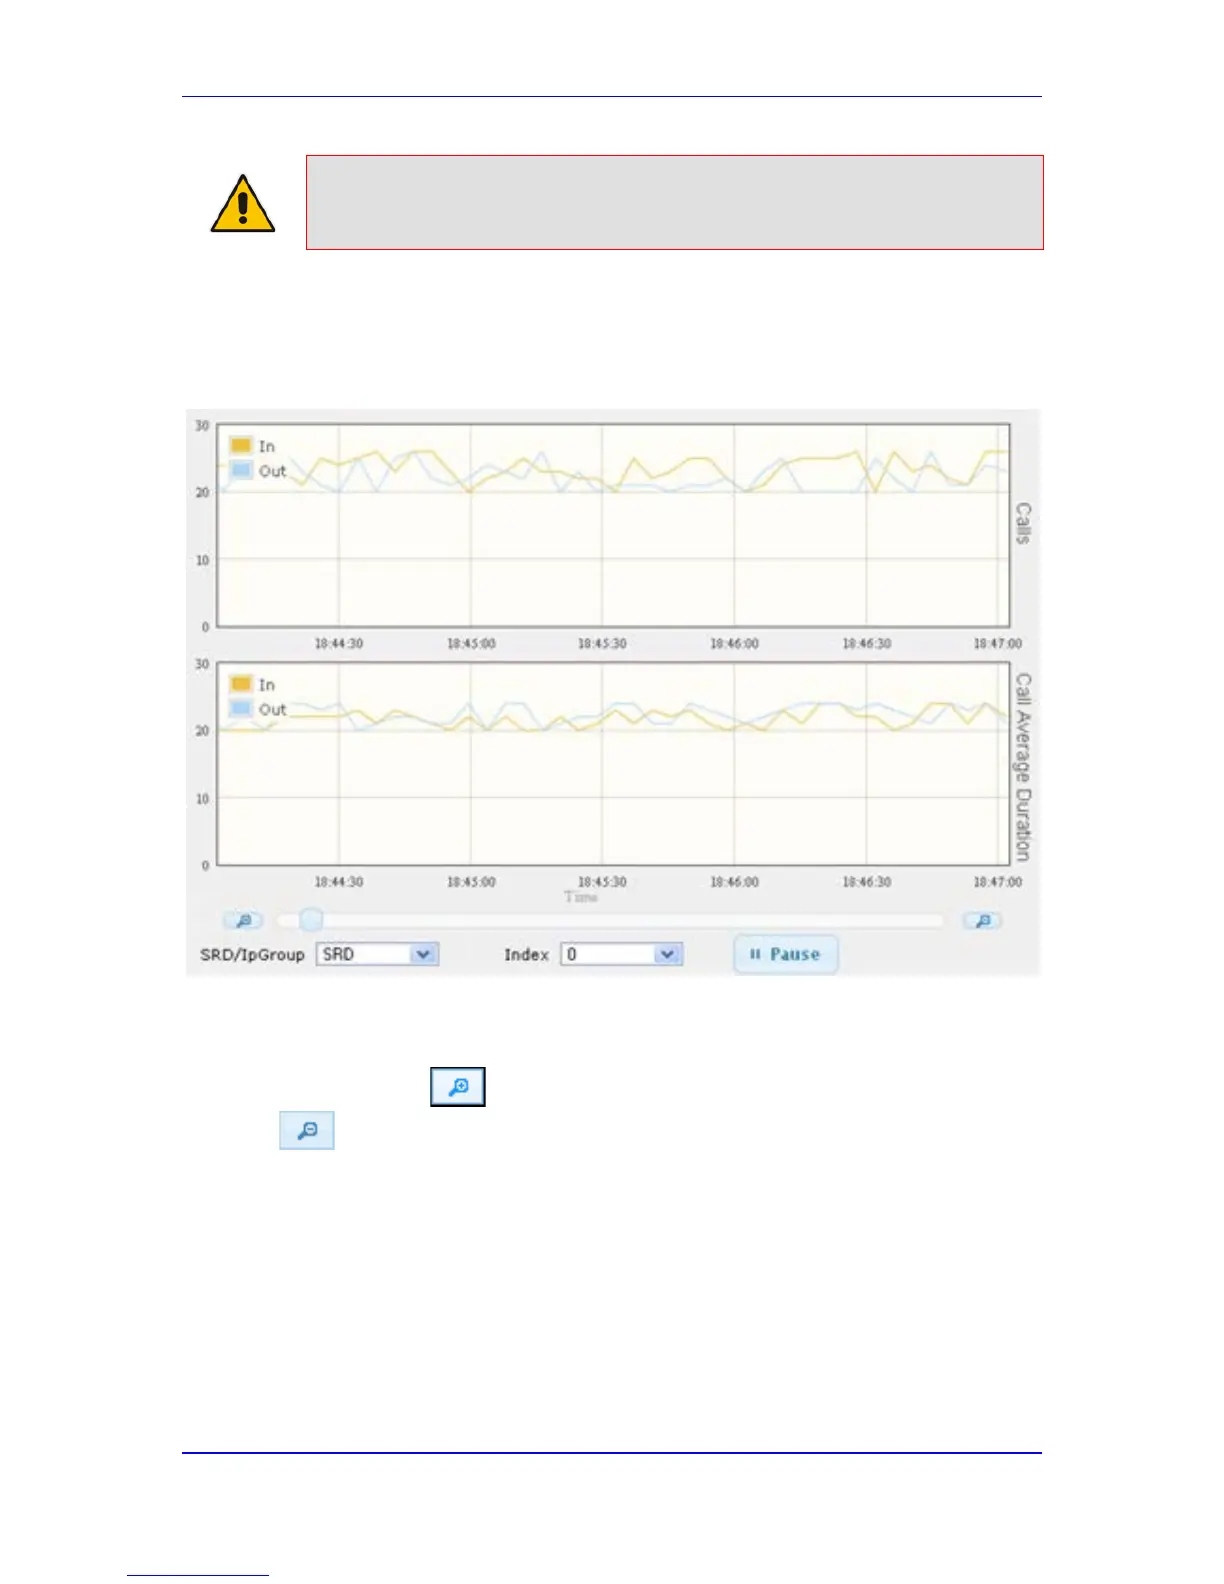
Figure 56-4: Average Call Duration Graph
2. From the 'SRD/IpGroup' drop-down list, select whether you want to view information
for an SRD or IP Group.
3. From the 'Index' drop-down list, select the SRD or IP Group index.
Use the Zoom In button to increase the displayed time resolution or the Zoom Out
button to decrease it. Instead of using these zoom buttons, you can use the slide
ruler. As you increase the resolution, more data is displayed on the graph. The minimum
resolution is about 30 seconds; the maximum resolution is about an hour.
To pause the graph, click the Pause button; click Play to resume.
56.5 Network Monitoring (Probing) Two Devices
The device can be configured to monitor the quality of the network path (network quality
monitoring - NQM) between it and other AudioCodes devices. The path monitoring is done
by sending packets from a "sender" device to a "responder" device and then calculating the
round-trip time (RTT), packet loss (PL), and jitter. Since both responder and sender nodes
are AudioCodes devices, the monitoring is done by sending RTP/RTCP packets in a way
 Loading...