Previews 117
Statistics and Data Plots
Statistics and Data Plots Statistics and Data Plots
Statistics and Data Plots
Based on a sample of seven cities, enter data that relates population to the number of
buildings with more than 12 stories. Using Median-Median and linear regression
calculations, find and plot equations to fit the data. For each regression equation, predict
how many buildings of more than 12 stories you would expect in a city of 300,000
people.
Steps and keystrokes Display
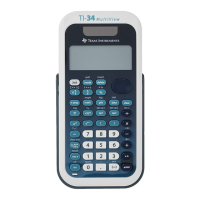
1. Display the MODE dialog box. For Graph
mode, select
FUNCTION.
Press 3 B 1 ¸
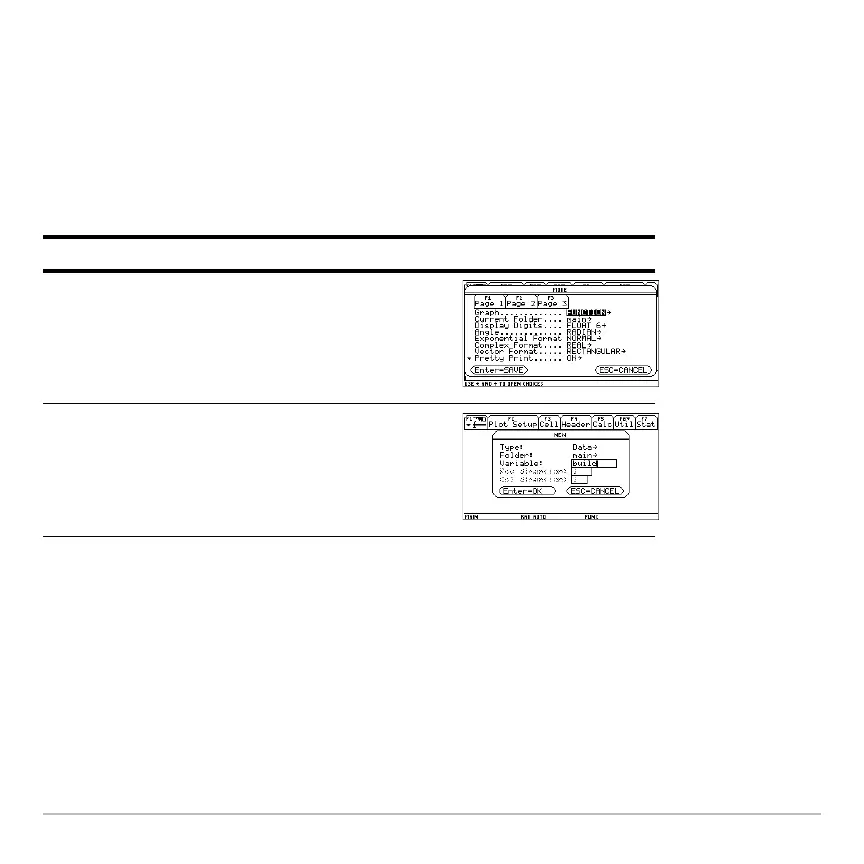
2. Use•O to display the
Data/Matrix Editor.
Create a new data variable named
BUILD.
Press 3 D D BUILD ¸ ¸

 Loading...