Basic Function Graphing 320
If your screen does not show coordinates, set the graph format so that Coordinates =
RECT
or POLAR. Press:
8
F
Each displayed y value is calculated from the x value; that is, y=yn(x). If the function is
undefined at an x value, the y value is blank.
You can continue to trace a function that goes above or below the viewing window. You
cannot see the cursor as it moves in that “off the screen” area, but the displayed
coordinate values show its correct coordinates.
Note: Use QuickCenter to trace a function that goes above or below the window.
Moving from Function to Function
Moving from Function to FunctionMoving from Function to Function
Moving from Function to Function
Press C or D to move to the previous or next selected function at the same x value. The
new function number is shown on the screen.
The “previous or next” function is based on the order of the selected functions in the Y=
Editor, not the appearance of the functions as graphed on the screen.
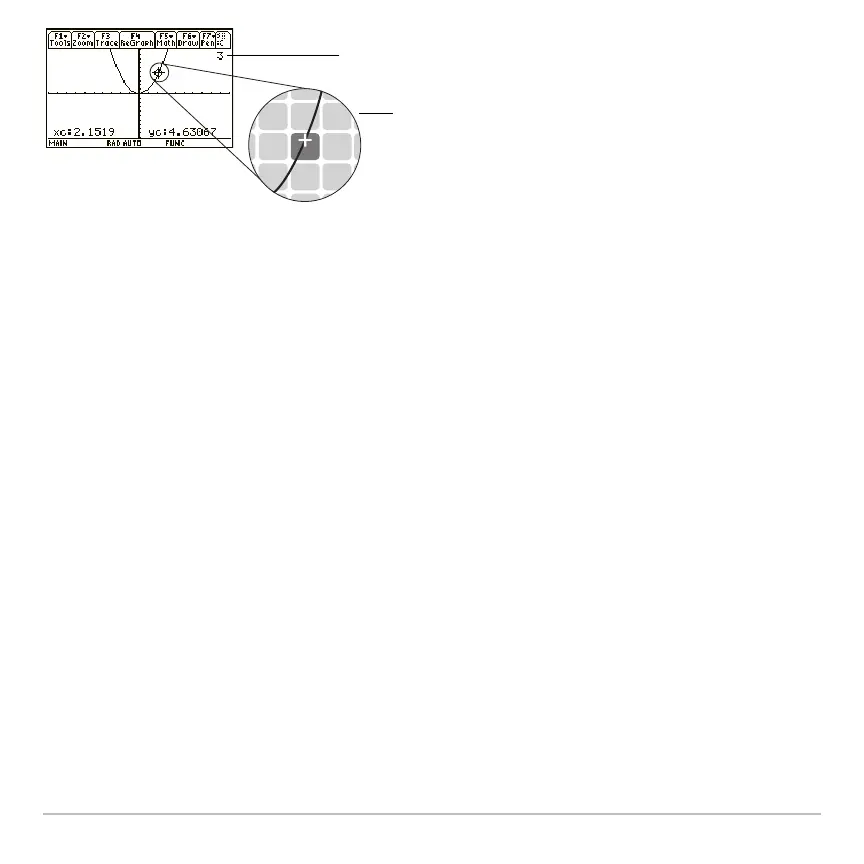
Trace coordinates are
those of the function, not
the pixel.
Function number being traced.
For example: y3(x).
 Loading...


