Statistics and Data Plots 557
Histogram
HistogramHistogram
Histogram
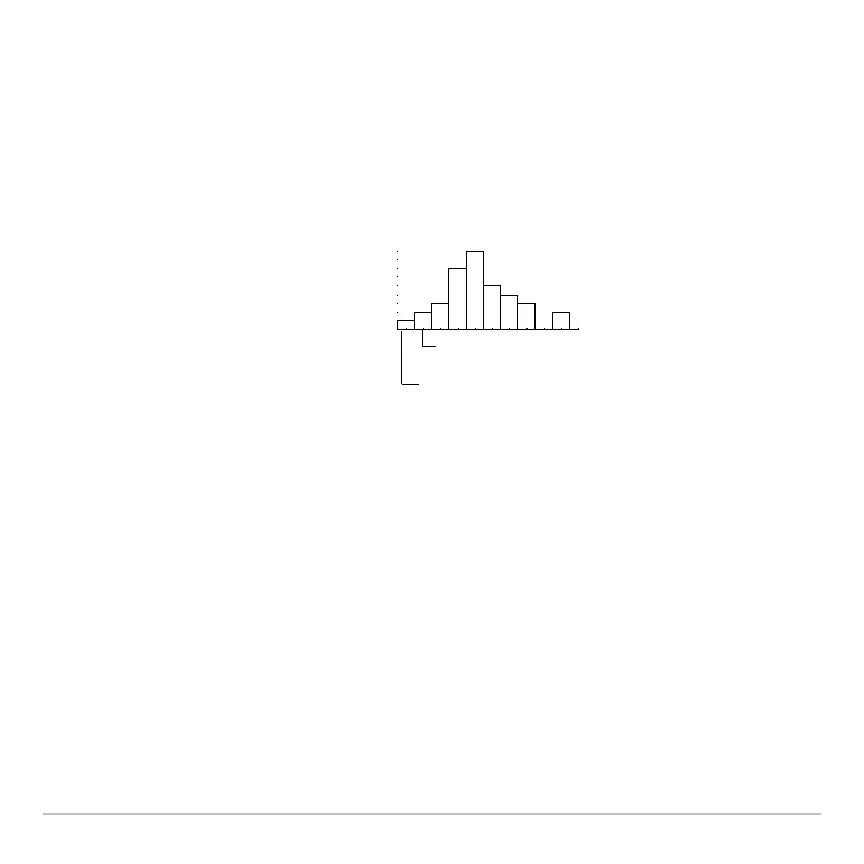
This plots one-variable data as a histogram. The x axis is divided into equal widths called
buckets or bars. The height of each bar (its y value) indicates how many data points fall
within the bar’s range.
•
ZoomData („ 9 from the Graph screen, Y= Editor, or Window Editor) adjusts xmin
and
xmax to include all data points, but it does not adjust the y axis.
- Use 8 $ to set
ymin = 0 and ymax = the number of data points expected
in the tallest bar.
• When defining the plot,
you can specify the
Hist.
Bucket Width
(default is 1)
to set the width of each
bar.
• A data point at the edge of
a bar is counted in the bar
to the right.
xmin + Hist. Bucket Width
xmin
Number of bars
xmax – xmin
Hist. Bucket Width
----------------------------------------------=

 Loading...