3D Graphing 374
3D Graphing
3D Graphing3D Graphing
3D Graphing
Overview of Steps in Graphing 3D Equations
Overview of Steps in Graphing 3D EquationsOverview of Steps in Graphing 3D Equations
Overview of Steps in Graphing 3D Equations
To graph 3D equations, use the same general steps used for y(x) functions as described
in Basic Function Graphing. Any differences that apply to 3D equations are described on
the following pages.
Graphing 3D Equations
Graphing 3D EquationsGraphing 3D Equations
Graphing 3D Equations
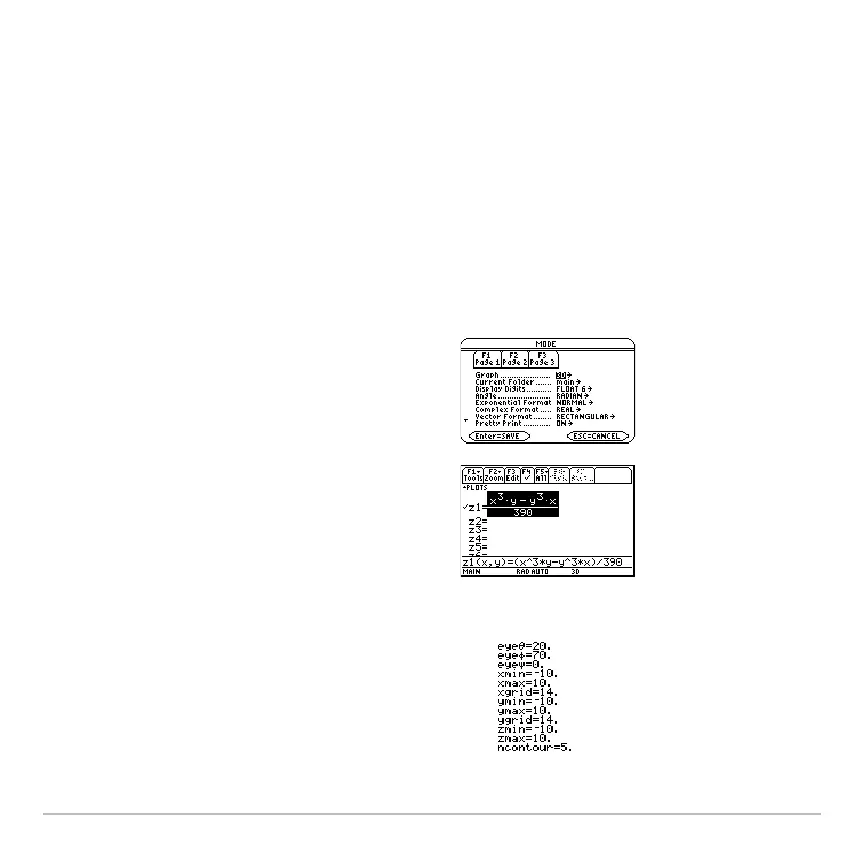
1. Set Graph mode (3) to
3D. Also set
Angle mode, if necessary.
2. Define 3D equations on Y= Editor
(8#).
3. Select (†) which equation to graph. You
can select only one 3D equation.
To turn off any stat data plots, press ‡
5
or use † to deselect them.
4. Define the viewing cube (8$).
For 3D graphs, the viewing window is
called the viewing cube. „
Zoom also
changes the viewing cube.

 Loading...