Basic Function Graphing 307
- “Graphing a Function Defined on the Home Screen” and “Graphing a Piecewise
Defined Function” in Additional Graphing Topics.
- “Overview of Entering a Function” in Programming.
• Store an expression directly to a function variable. Refer to:
- “Storing and Recalling Variable Values” in Operating the Calculator.
- “Creating and Evaluating User-Defined Functions” in Calculator Home Screen.
Note: User-defined functions can have almost any name. However, if you want them to
appear in the Y= Editor, use function names
y1(x), y2(x), etc.
Selecting Functions to Graph
Selecting Functions to GraphSelecting Functions to Graph
Selecting Functions to Graph
Regardless of how many functions are defined in the Y= Editor, you can select the ones
you want to graph.
Selecting or Deselecting Functions
Selecting or Deselecting FunctionsSelecting or Deselecting Functions
Selecting or Deselecting Functions
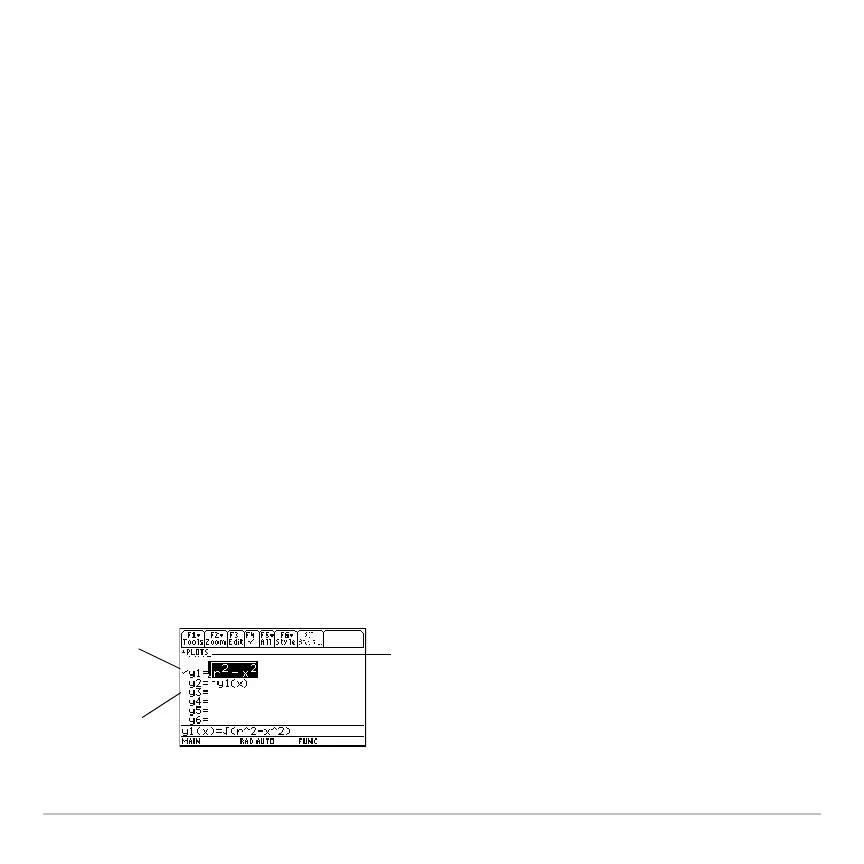
Press 8# to display the Y= Editor.
A “Ÿ” indicates which functions will be graphed the next time you display the Graph
screen.
Selected
Deselected
If PLOT numbers are
displayed, those stat plots are
selected.
In this example, Plots 1 and 2
are selected. To view them,
scroll above y1=.