Basic Function Graphing 309
Setting the Display Style for a Function
Setting the Display Style for a FunctionSetting the Display Style for a Function
Setting the Display Style for a Function
For each defined function, you can set a style that specifies how that function will be
graphed. This is useful when graphing multiple functions. For example, set one as a
solid line, another as a dotted line, etc.
Displaying or Changing a Function’s Style
Displaying or Changing a Function’s StyleDisplaying or Changing a Function’s Style
Displaying or Changing a Function’s Style
From the Y= Editor:
1. Move the cursor to highlight the applicable function.
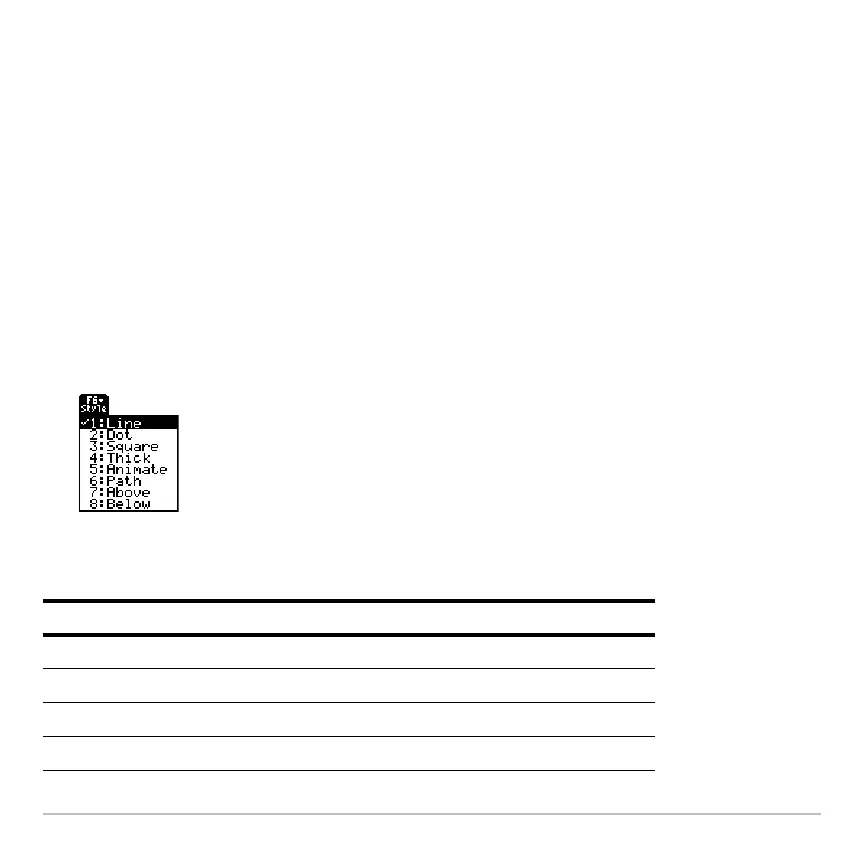
2. Select the
Style menu and press: ˆ
3. To make a change, select the applicable style.
• Although the Line item is initially
highlighted, the function’s current style is
indicated by a Ÿ mark.
• To exit the menu without making a
change, press N.
Style Description
Line Connects plotted points with a line. This is the default.
Dot Displays a dot at each plotted point.
Square Displays a solid box at each plotted point.
Thick Connects plotted points with a thick line.

 Loading...