Statistics and Data Plots 553
5. Press ¸ (after typing in an input box, press ¸ twice).
Note: Any undefined data points (shown as undef) are ignored in a stat plot.
Selecting or Deselecting a Plot
Selecting or Deselecting a PlotSelecting or Deselecting a Plot
Selecting or Deselecting a Plot
From Plot Setup, highlight the plot and press †
to toggle it on or off. If a stat plot is
selected, it remains selected when you:
• Change the graph mode. (Stat plots are not graphed in 3D mode.)
• Execute a Graph command.
• Open a different variable in the Data/Matrix Editor.
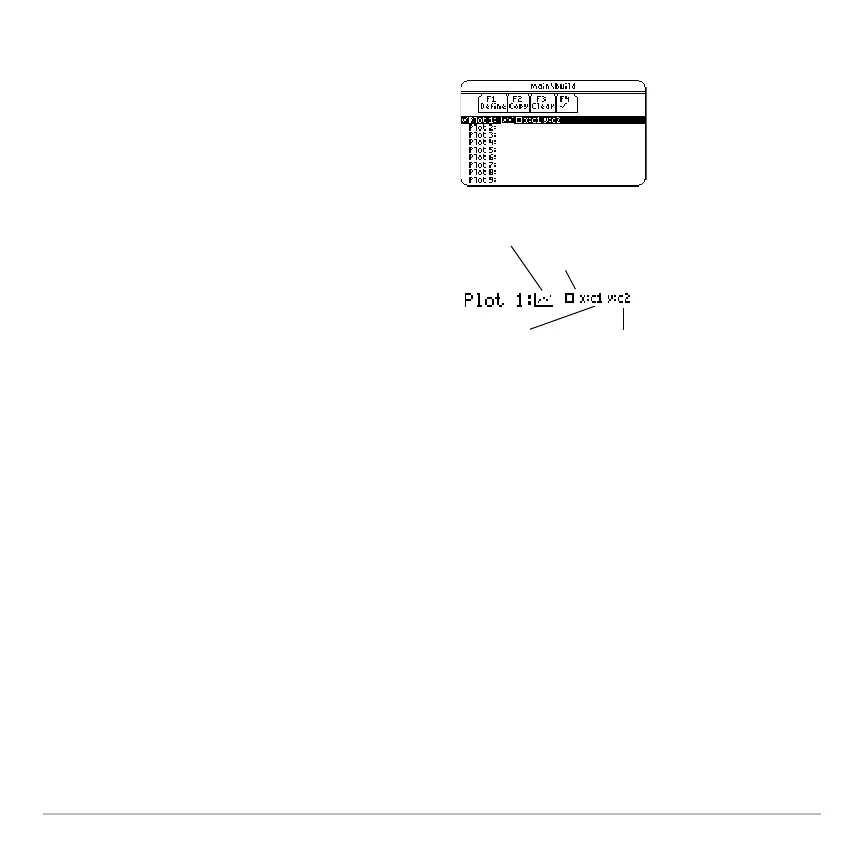
The
Plot Setup screen is redisplayed.
The plot you just defined is automatically
selected for graphing.
Notice the shorthand definition for the
plot.
Plot Type = Scatter
Mark = Box
y = c2 x = c1

 Loading...