Statistics and Data Plots 556
Box Plot
Box PlotBox Plot
Box Plot
This plots one-variable data with respect to the minimum and maximum data points
(
minX and maxX) in the set.
• When you select multiple box plots, they are plotted one above the other in the same
order as their plot numbers.
• Use NewPlot to show statistical data as a modified box plot.
• Select Mod Box Plot as the Plot Type when you define a plot in the Data/Matrix
Editor.
A modified box plot excludes points outside the interval [
Q1NX, Q3+X], where X is defined
as
1.5 (Q3NQ1). These points, called outliers, are plotted individually beyond the box
plot’s whiskers, using the mark that you select.
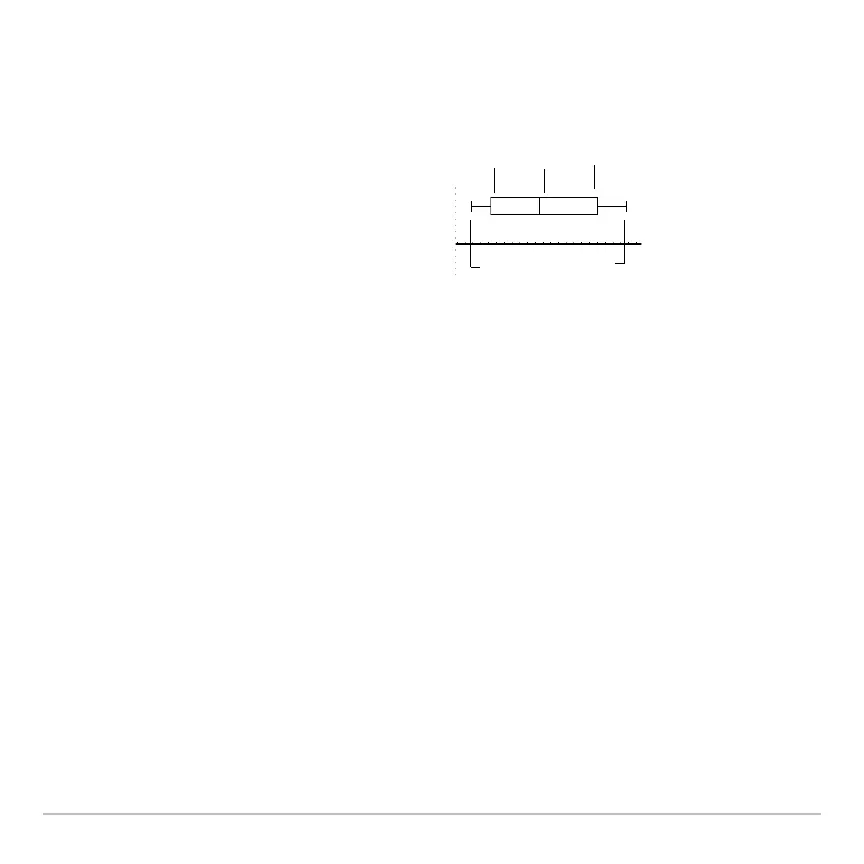
• A box is defined by its first quartile (
Q1),
median (
Med), and third quartile (Q3).
• Whiskers extend from
minX to Q1 and
from
Q3 to maxX.
Q1 Med Q3
minx maxX

 Loading...