3D Graphing 403
Notes:
• For more accurate estimates, increase the xgrid and ygrid Window variables.
However, this increases the graph evaluation time.
• When you animate the graph, the screen changes to normal view. Use p to toggle
between normal and expanded views.
Implicit Plots
Implicit PlotsImplicit Plots
Implicit Plots
An implicit plot is used primarily as a way to graph 2D implicit forms that cannot be
graphed in function graphing mode. Technically, an implicit plot is a 3D contour plot with
a single contour drawn for
z=0 only.
Explicit and Implicit Forms
Explicit and Implicit FormsExplicit and Implicit Forms
Explicit and Implicit Forms
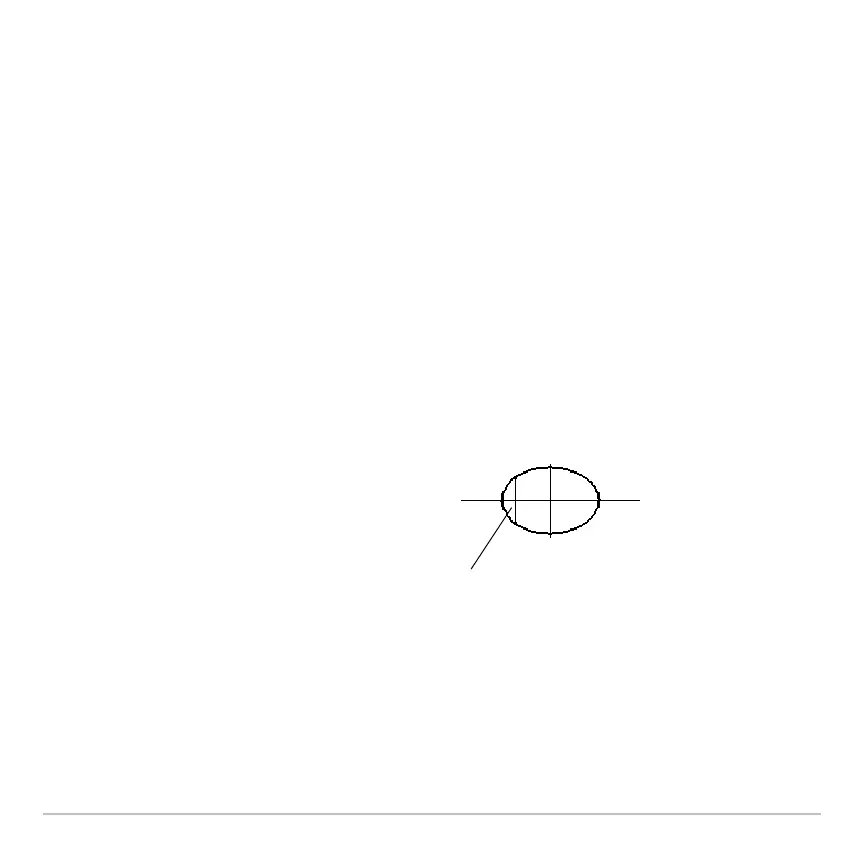
In 2D function graphing mode, equations have
an explicit form
y=f(x), where y is unique for
each value of x.
Many equations, however, have an implicit
form
f(x,y)=g(x,y), where you cannot explicitly
solve for y in terms of x or for x in terms of y.
y is not unique for
each x, so you cannot
graph this in function
graphing mode.

 Loading...