Statistics and Data Plots 559
Showing the List of Stat Plots
Showing the List of Stat PlotsShowing the List of Stat Plots
Showing the List of Stat Plots
Press 8# to display the Y= Editor. Initially, the nine stat plots are located “off the top”
of the screen, above the
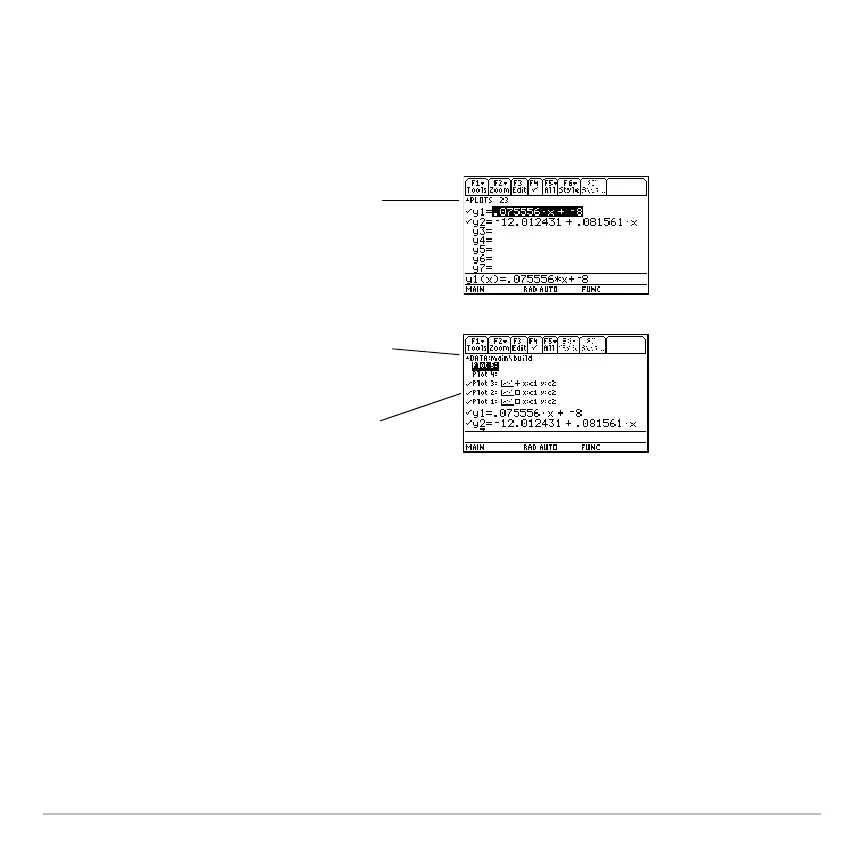
y(x) functions. However, the PLOTS indicator provides some
information.
To see the list of stat plots, use C to scroll
above the
y(x) functions.
From the Y= Editor, you can perform most of
the same operations on a stat plot as you can
on any other
y(x) function.
For example, PLOTS 23 means
that Plots 2 & 3 are selected.
If a Plot is highlighted, this shows
the data variable that will be used
for the plots.
If a Plot is defined, it shows the
same shorthand notation as the
Plot Setup screen.

 Loading...