EasyManuals Logo
Home>Texas Instruments>Calculator>Voyage 200

Texas Instruments Voyage 200 User Manual

Texas Instruments Voyage 200
1008 pages
To Next Page IconTo Next Page
To Previous Page IconTo Previous Page
Page #558 background imageLoading...
Page #558 background image
Statistics and Data Plots 558
Using the Y= Editor with Stat Plots
Using the Y= Editor with Stat PlotsUsing the Y= Editor with Stat Plots
Using the Y= Editor with Stat Plots
The previous sections described how to define and select stat plots from the Data/Matrix
Editor. You can also define and select stat plots from the Y= Editor.
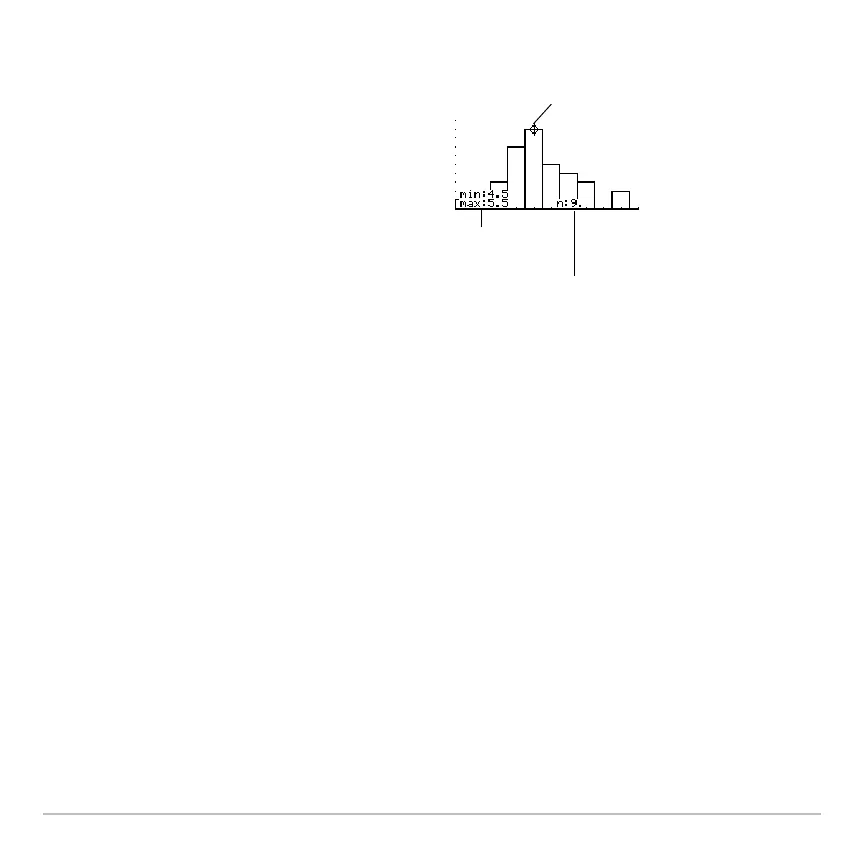
When you trace () a histogram, the
screen shows information about the
traced bar.
Trace cursor
Range of the
traced bar
# of data points in
the traced bar

Table of Contents

Other manuals for Texas Instruments Voyage 200

Questions and Answers:

Question and Answer IconNeed help?

Do you have a question about the Texas Instruments Voyage 200 and is the answer not in the manual?

Texas Instruments Voyage 200 Specifications

General IconGeneral
TypeScientific
Form factorPocket
Product colorBlue
Display resolution128 x 240 pixels

Related product manuals