3D Graphing 384
For example, consider a saddle shape z1(x,y) = (x
2
Ny
2
) / 3. The following graph shows
the view looking down the y axis.
Now look at the same shape at 10¡ from the x axis (eyeq = 10).
Note: To cut away the front of the saddle in this example, set xmax=0 to show only
negative x values.
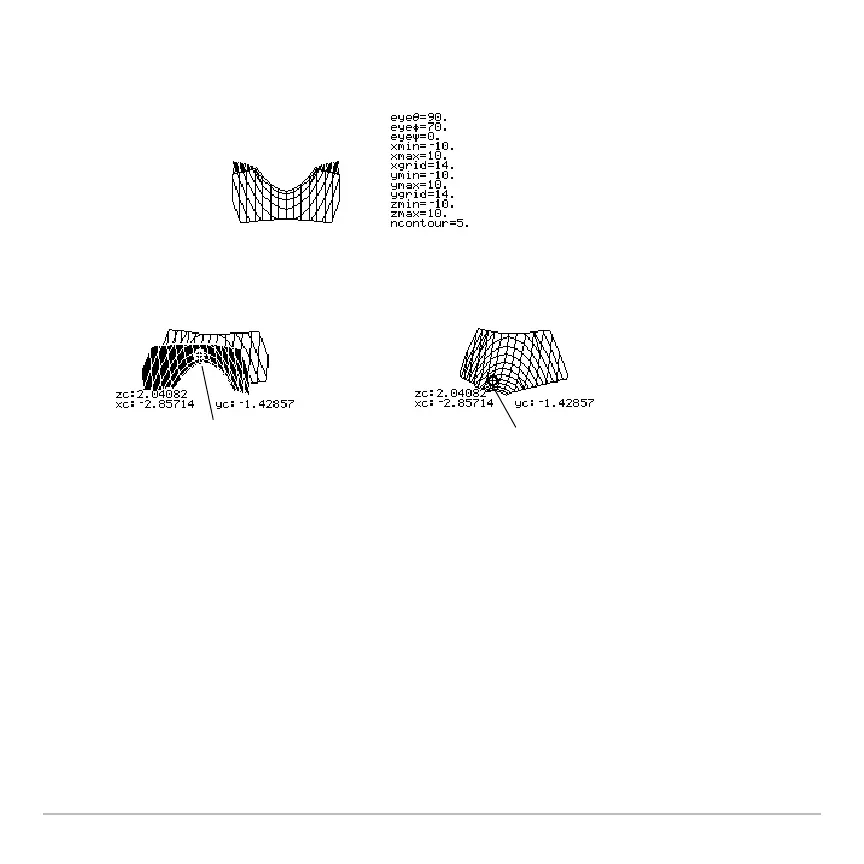
Example of an “Off the Curve” Cursor
Example of an “Off the Curve” CursorExample of an “Off the Curve” Cursor
Example of an “Off the Curve” Cursor
Although the cursor can move only along a grid wire, you will see many cases where the
cursor does not appear to be on the 3D surface at all. This occurs when the z axis is too
short to show
z(x,y) for the corresponding x and y values.
You can move the cursor so
that it does not appear to be
on a grid point.
If you cut away the front side,
you can see the cursor is
actually on a grid point on the
hidden back side.

 Loading...