EasyManuals Logo
Home>Texas Instruments>Calculator>Voyage 200

Texas Instruments Voyage 200 User Manual

Texas Instruments Voyage 200
1008 pages
To Next Page IconTo Next Page
To Previous Page IconTo Previous Page
Page #555 background imageLoading...
Page #555 background image
Statistics and Data Plots 555
Scatter
ScatterScatter
Scatter
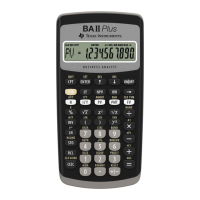
Data points from x and y are plotted as coordinate pairs. Therefore, the columns or lists
that you specify for x and y must be the same length.
Xyline
XylineXyline
Xyline
Plotted points are shown with the symbol
that you select as the Mark.
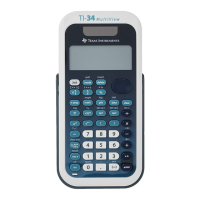
If necessary, you can specify the same
column or list for both x and y.
This is a scatter plot in which data points are
plotted and connected in the order in which
they appear in x and y.
You may want to sort all the columns in the
Data/Matrix Editor before plotting.
3 or ˆ 4

Table of Contents

Other manuals for Texas Instruments Voyage 200

Questions and Answers:

Question and Answer IconNeed help?

Do you have a question about the Texas Instruments Voyage 200 and is the answer not in the manual?

Texas Instruments Voyage 200 Specifications

General IconGeneral
TypeScientific
Form factorPocket
Product colorBlue
Display resolution128 x 240 pixels

Related product manuals