Statistics and Data Plots 540
Statistics and Data Plots
Statistics and Data PlotsStatistics and Data Plots
Statistics and Data Plots
Overview of Steps in Statistical Analysis
Overview of Steps in Statistical AnalysisOverview of Steps in Statistical Analysis
Overview of Steps in Statistical Analysis
This section gives an overview of the steps used to perform a statistical calculation or
graph a statistical plot. For detailed descriptions, refer to the following pages.
1. Set Graph mode (3) to
FUNCTION.
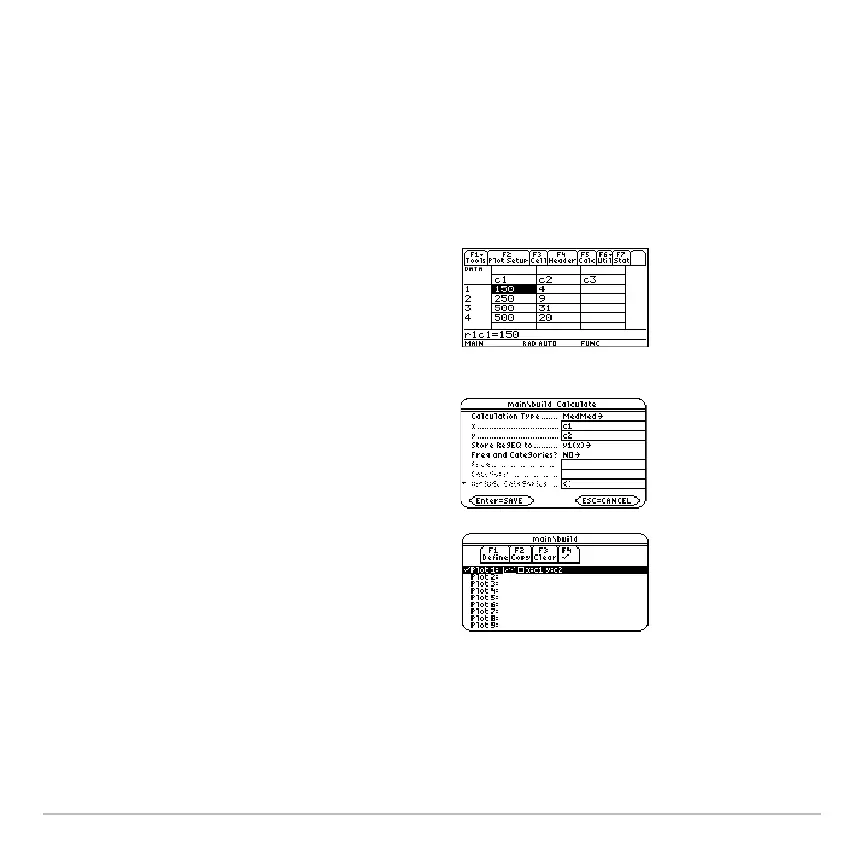
2. Enter stat data in the Data/Matrix Editor.
Note: Refer to the Data/Matrix Editor
module for details on entering data in the
Data/Matrix Editor.
3. Perform stat calculations to find stat
variables or fit data to a model (‡).
4. Define and select stat plots („
and then
,).
Note: You can also use the Y= Editor to
define and select stat plots and
y(x)
functions.
5. Define the viewing window (8$).

 Loading...