882 Appendix A: Functions and Instructions
stdDevPop() MATH/Statistics menu
stdDevPop(
list
[
, freqlist
]) ⇒
⇒⇒
⇒
expression
Returns the population standard deviation of the
elements in
list
.
Each
freqlist
element counts the number of
consecutive occurrences of the corresponding
element in
list
.
Note:
list
must have at least two elements.
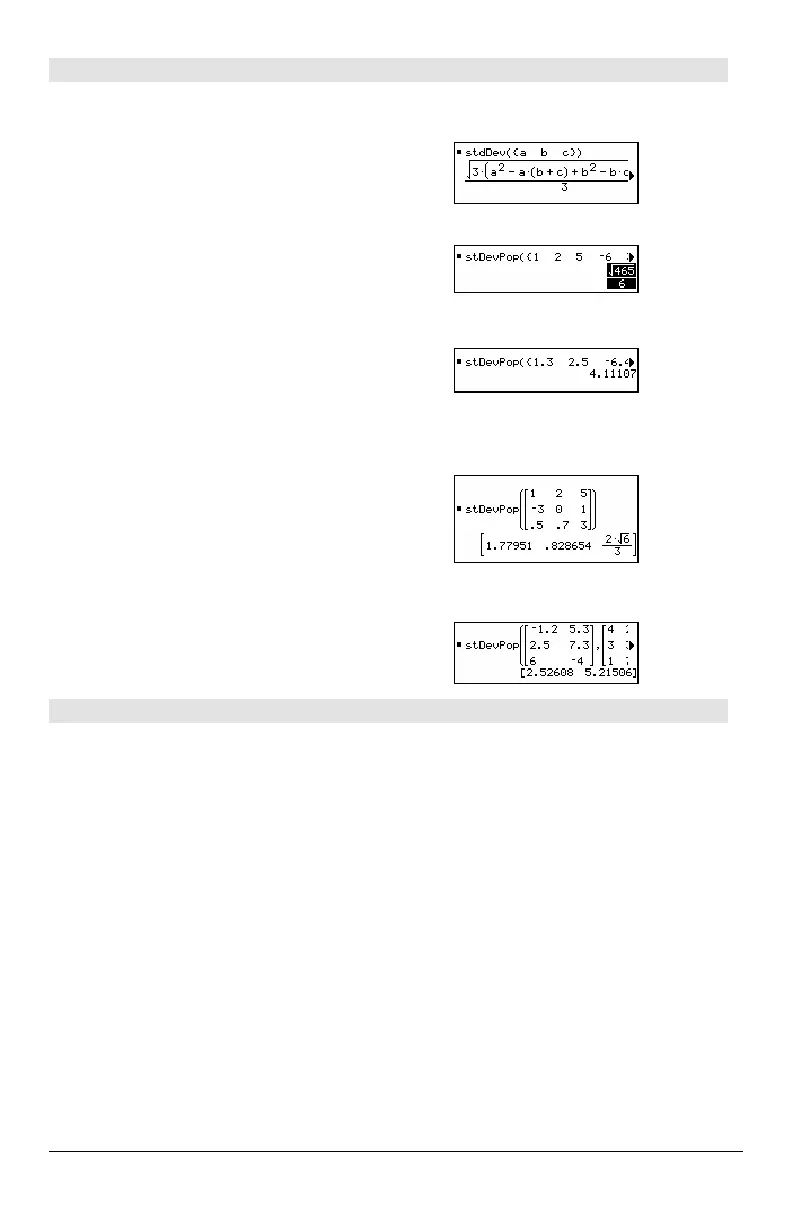
In Radian angle and auto modes:
stdDevPop({a,b,c}) ¸
stdDevPop({1,2,5,
ë 6,3,ë 2}) ¸
stdDevPop({1.3,2.5,
L6.4},{3,2,5})
¸
stdDevPop(matrix1[, freqmatrix]) ⇒
⇒⇒
⇒ matrix
Returns a row vector of the population standard
deviations of the columns in
matrix1
.
Each
freqmatrix
element counts the number of
consecutive occurrences of the corresponding
element in
matrix1
.
Note:
matrix1
must have at least two rows.
stdDevPop([[1,2,5][-3,0,1][.5,.7,3]])
¸
stdDevPop([
L1.2,5.3;2.5,7.3;6,L4],[4,
2;3,3;1,7])
¸
StoGDB CATALOG
StoGDB
GDBvar
Creates a Graph database (GDB) variable that
contains the current:
* Graphing mode
* Y= functions
* Window variables
* Graph format settings
1- or 2-Graph setting (split screen and ratio
settings if 2-Graph mode)
Angle mode
Real/complex mode
* Initial conditions if Sequence or
Diff Equations mode
* Table flags
* tblStart, @tbl, tblInput
You can use
RclGDB
GDBvar
to restore the graph
environment.
*Note: These items are saved for both graphs in
2-Graph mode.

 Loading...


