Instructions for use – Infinity Acute Care System – Monitoring Applications VG6.n 169
Trends/data dialogs
Analysis tool page
The Analysis tool page is a comprehensive trend
page for visualizing information necessary to
perform a recruitment maneuver. The page shows
the effects on lung mechanics and hemodynamic
parameters on a single, integrated display. The
Analysis tool page displays a duration of data
configured by the user on three graphical trend
panels simultaneously. The page is divided into
three separate graphical trend panels with the
following initial default setup which is configurable:
– The top graphical trend panel displays PIP,
PEEP, ART M
– The middle graphical trend panel displays VT,
Cdyn
– The bottom graphical trend panel displays
SpO2, etCO2
Each graphical trend panel displays up to three
parameters and associated values. Use the cursor
buttons to reference separate data points on the
graphs. The corresponding values are displayed
next to the graphs. The current values for the
selected trend parameters are always displayed
across the top of the screen.
To access the Analysis tool page
1 Select the Procedures... button from the main
menu bar.
2 Select the Analysis tool tab.
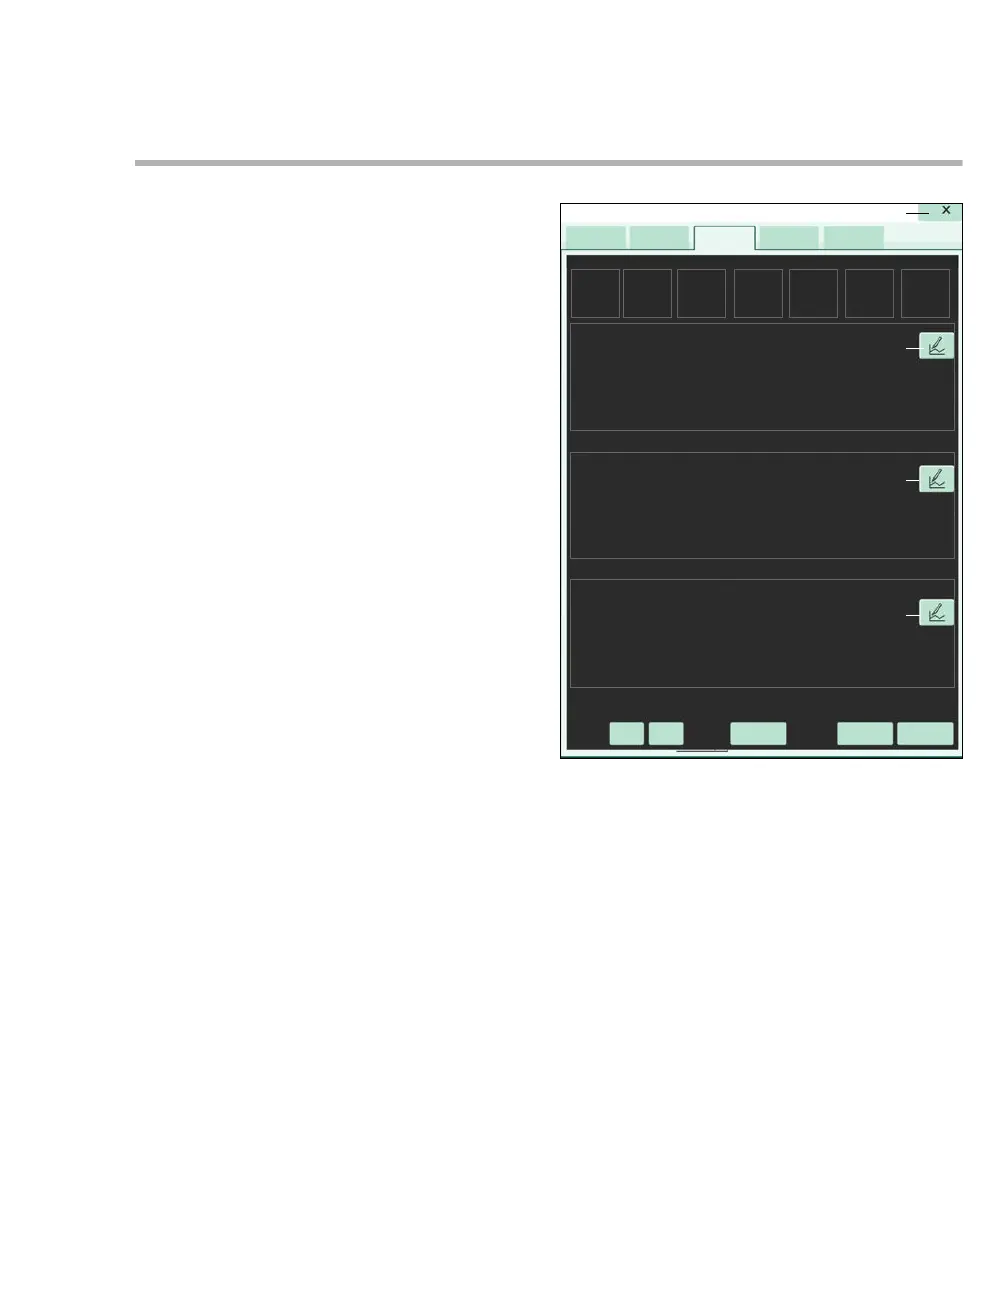
The layout of the Analysis tool page
The following diagram depicts the Analysis tool
page.
A Analysis tool tab
B Button that closes the page
C Trend setup symbols for selecting up to three
parameters per panel
D Print button
E Freeze button for freezing the trend display
F Duration button for setting duration interval for
the trend display
G Cursor button for marking the end point
H Cursor button for marking the initial point
I Graphical trend parameter fields
J Current parameter values originating from the
device (parameter value, parameter label)
490
A
B
D
C
C
C
EGH
JJJJJJJ
I
I
I
Procedures
F
 Loading...