11 - 2 BeneVision N Series Patient Monitor Operator’s Manual
11.3 ECG Display
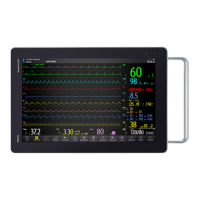
The following figures show the ECG waveform and numeric areas. Your display may be configured to look
slightly different.
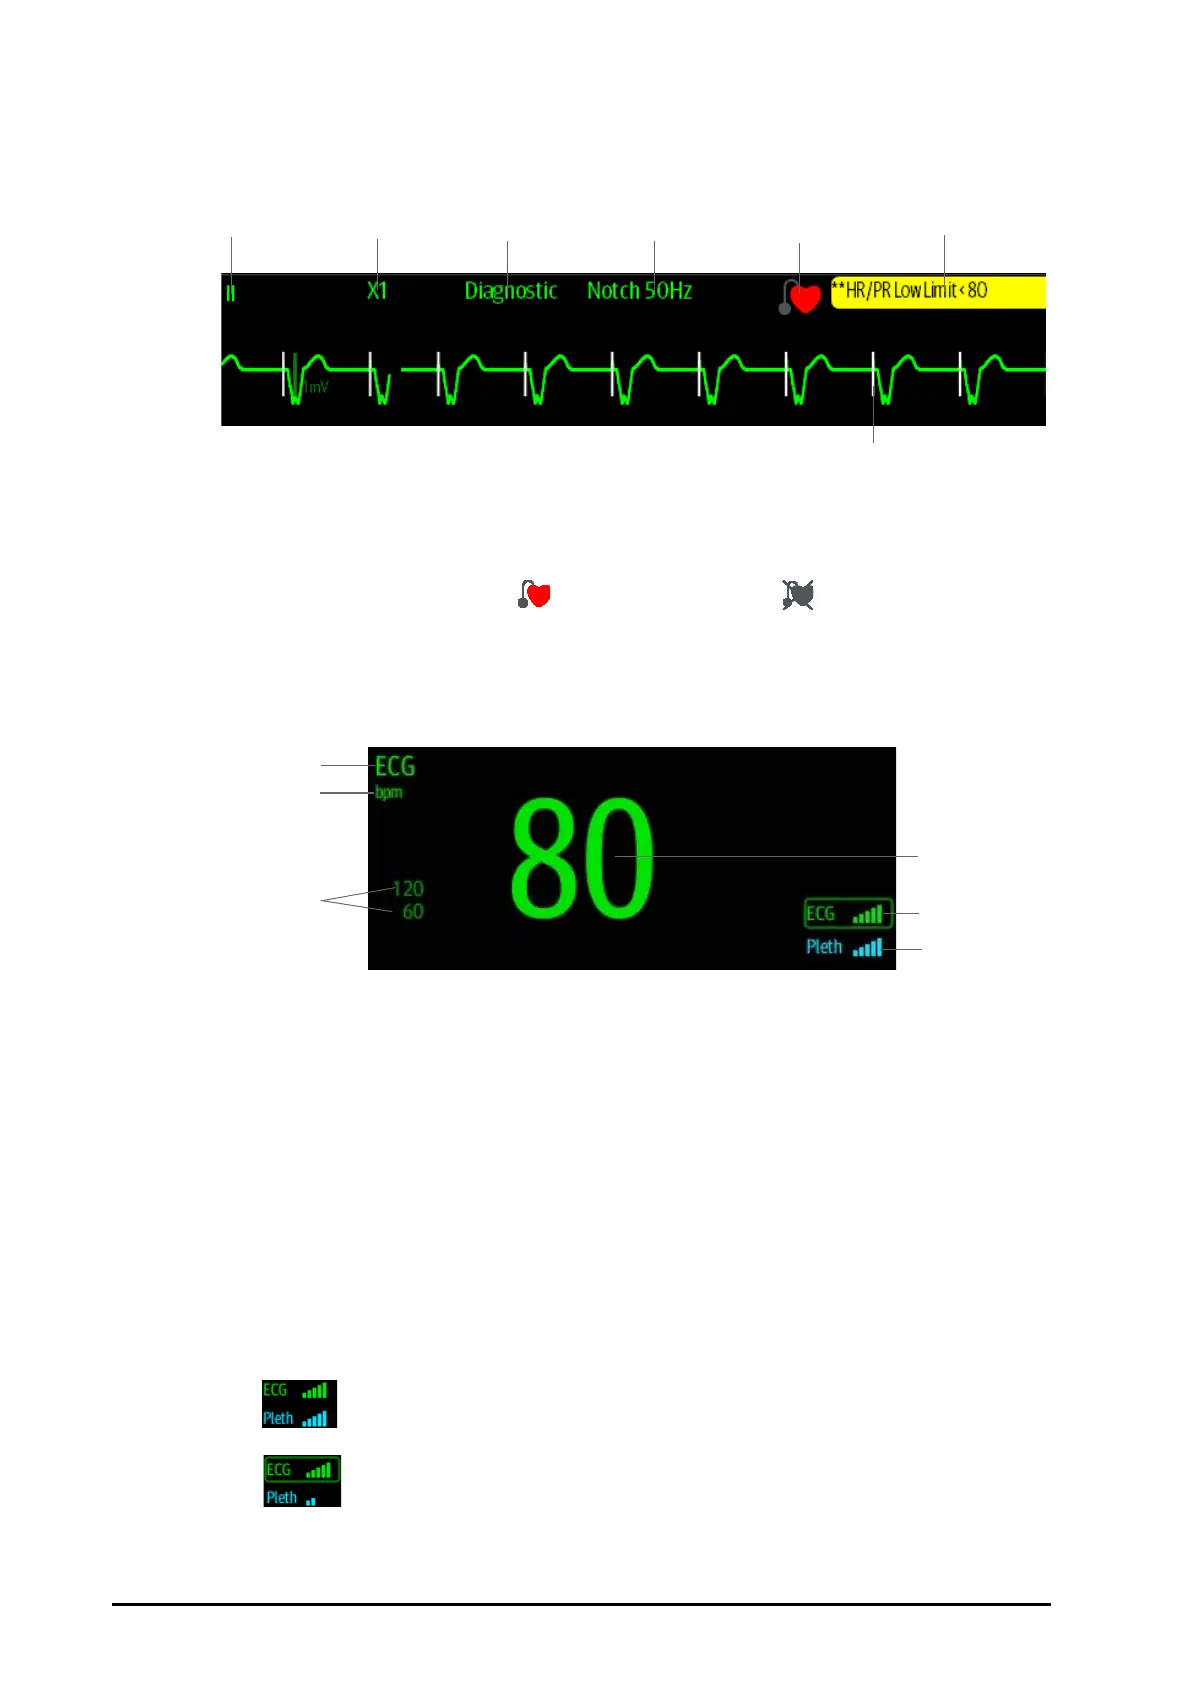
SQI with five highlighted bars indicates the best signal. SQI with one highlighted bar indicates the poorest signal.
I
f the SQI is poor, check ECG electrodes or SpO
2
sensor application. Reposition the electrodes or sensor if
necessary.
The CrozFusion
TM
function analyzes the ECG signal and the Pleth wave signal together to achieve more accurate
arrhythmia analysis result and HR/PR measurements. To view the on-screen help for the CrozFusion
TM
function,
select the CrozFusion tab from the ECG menu.
The ECG SQI, Pleth SQI, and signal fusion status are displayed when the CrozFusion
TM
function is enabled. The
following table lists SQI indications of different signal fusion status:
(1) ECG lead label of the displayed waveform, When 6-lead placement is used to derive 12-lead ECG (D12L), all
derived leads are marked with a "d" in front of the lead label, for example “dV1”.
(2) ECG waveform gain (3) ECG filter mode (4) Notch filter status
(5) Paced status: If Paced is set to Ye s , is displayed. If Paced is set to No, is displayed.
(6) HR/PR alarm message
(7) Pace pulse mark: If Paced is set to Ye s , the pace pulse markers “|” are displayed corresponding to detected pace
pulse on each ECG waveform.
(8) Parameter label (9) HR unit
(10) HR alarm limits (11) HR value
(12) ECG signal quality index (ECG SQI) (13) Pleth signal quality index (Pleth SQI)
The quality of both ECG and Pleth signal is good. ECG signal and Pleth signal are independently
analyzed.
The quality of Pleth signal is poor. The PR value may be erroneous. The ECG signal is being used to
correct the PR value.
(1) (2) (3) (4) (5) (6)
(7)
 Loading...