33 - 8 BeneVision N Series Patient Monitor Operator’s Manual
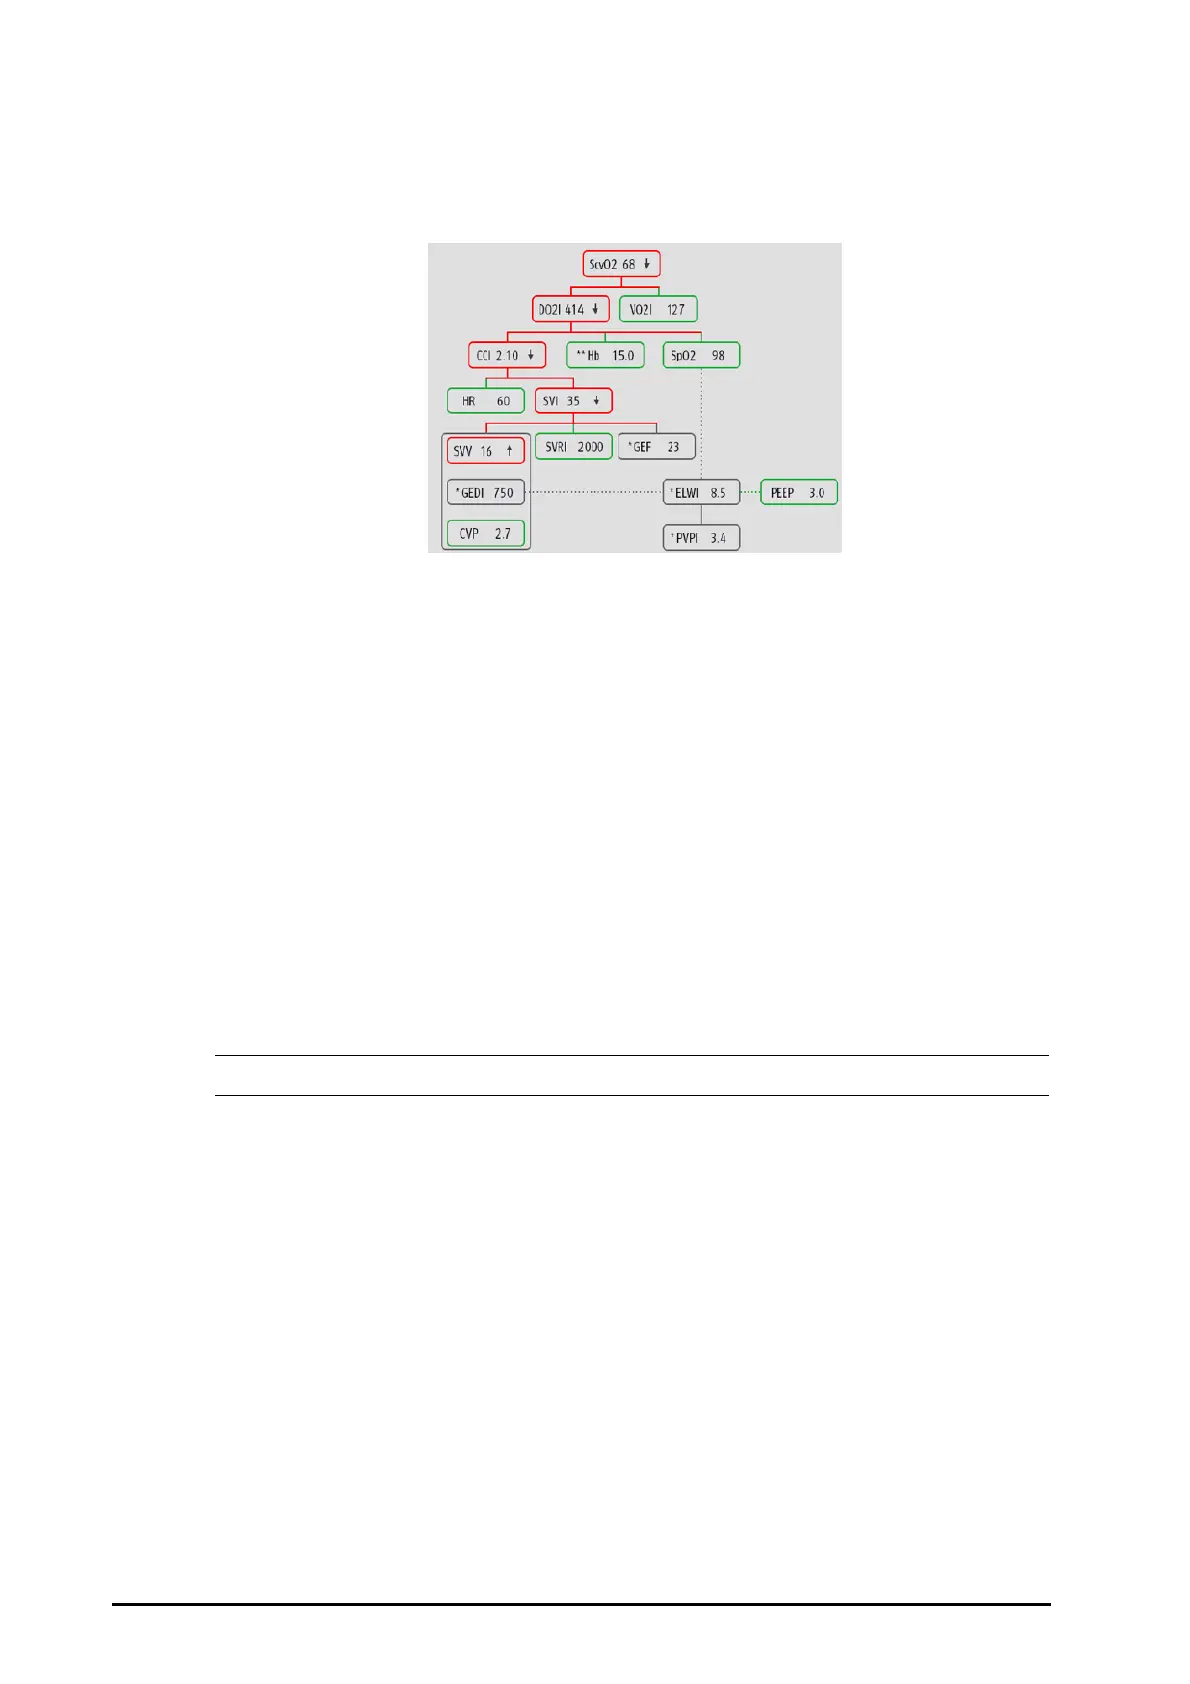
33.3.3 Physiology Relationship
The Physiology Relationship screen depicts the balance between oxygen delivery (DO
2
) and estimated oxygen
consumption (VO
2
). It automatically updates as parameter values change so the displayed values are always
current. The connecting lines highlight the relationship of the parameters to each other.
In the Physiology Relationship screen, the connecting lines have the following meanings:
■ Solid line: indicates that parameters connected have direct relationship.
■ Dotted line: indicates that parameters connected have indirect relationship.
■ Red frame: the parameter value is out of its normal range.
■ Green frame: the parameter value is within its normal range.
■ Gray frame: the parameter value is not available.
In the Physiology Relationship screen, each parameter frame displays the following contents:
■ Parameter name
■ Parameter value (”--” if parameter value is not available)
■ * (if the parameter is intermittent)
■ ** (if the parameter value is input manually)
■ ↑ or ↓ (if the parameter value exceeds its upper or lower limit)
• For different modules, parameters displayed in the Physiology Relationship screen are different.
 Loading...