33 - 6 BeneVision N Series Patient Monitor Operator’s Manual
33.3.2 Physiology Graphics
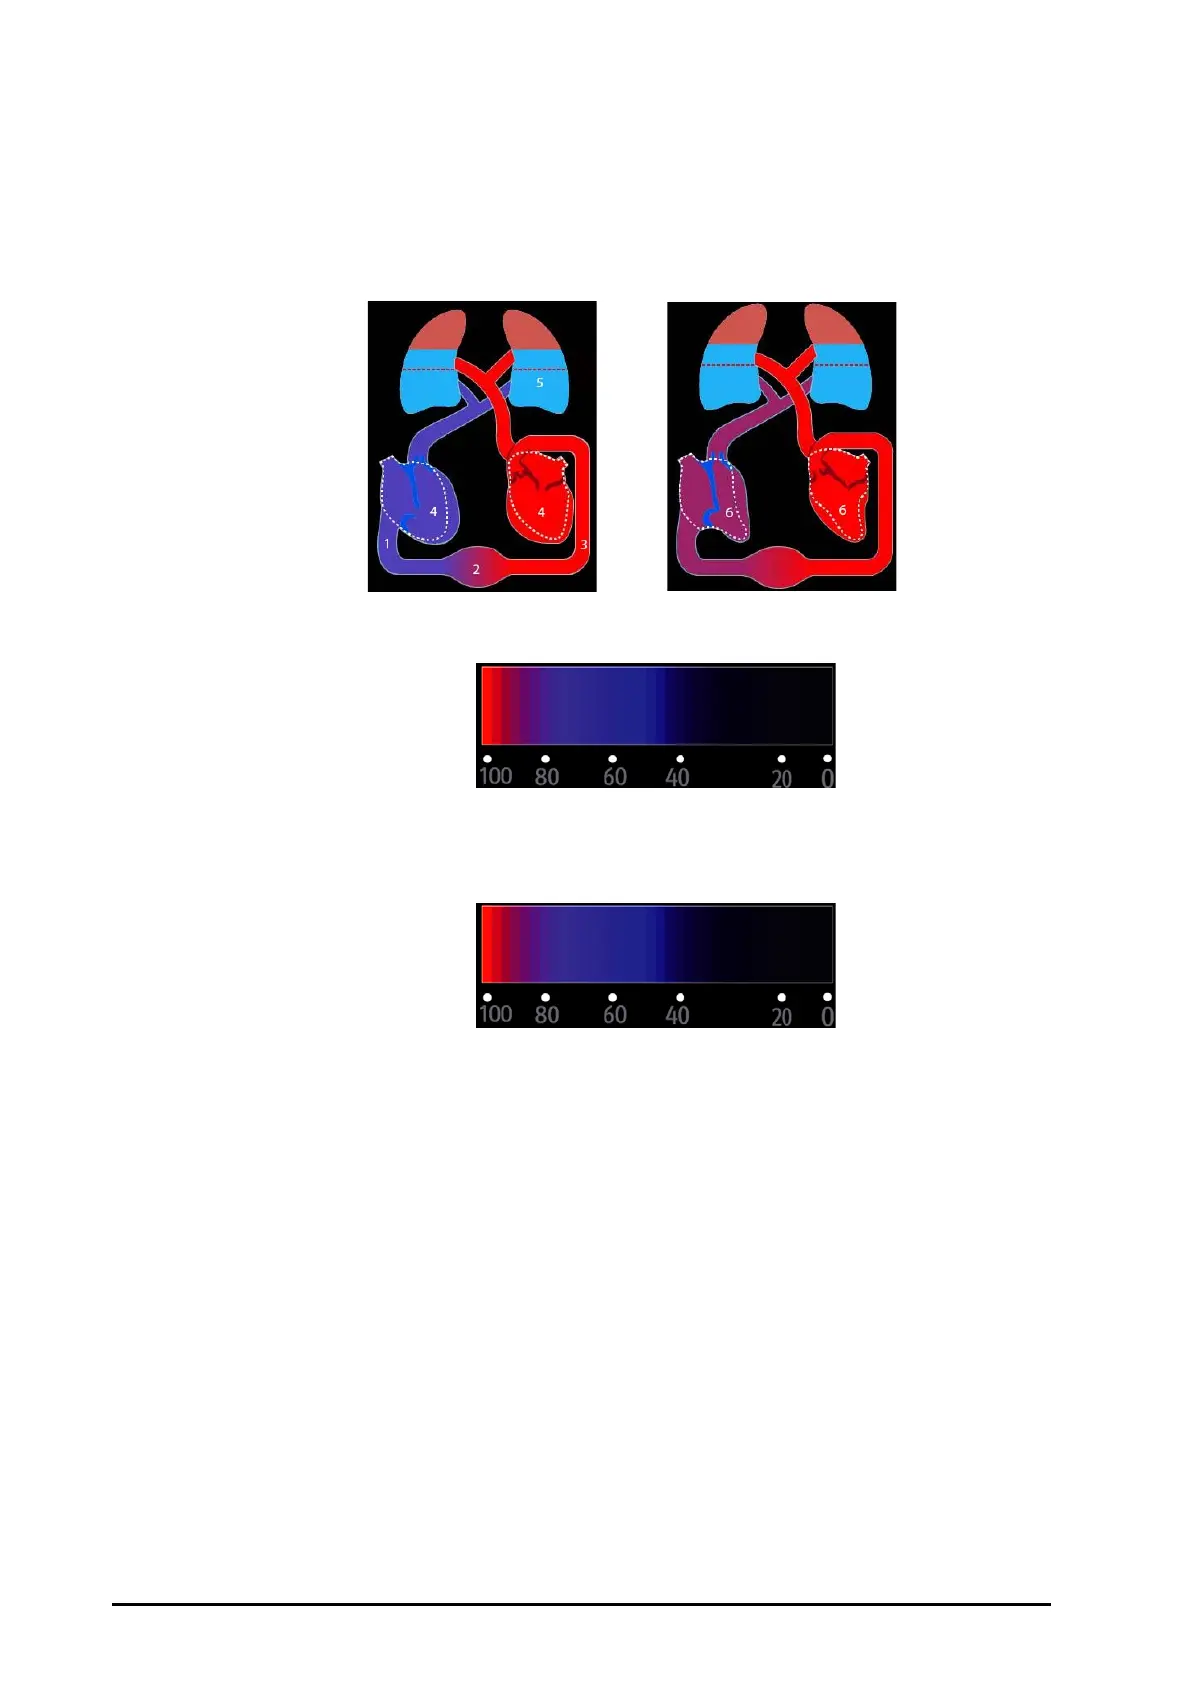
The lungs, heart and circulatory system vary according to the patient’s condition at the time of the
thermodilution measurement. The Physiology Graphics displays monitored parameters using animation,
which gives a visual representation of the interaction between the heart, lungs, blood, and vascular system . The
continuous parameter values are displayed in realtime. When the intermittent data is available, the animation
changes to reflect this change. The heart rate showed by the animation is also a visual reflection of the patient
heart rate.
(1) When ScvO
2
or SvO
2
is available, the change in color indicates the change of ScvO
2
or SvO
2
values.
(2) When CVP and SVRI are available, the change in blood vessel diameter indicates the change of SVRI values. For more
information, see
33.3.2.1Systemic Vascular Resistance Status.
(3) When SpO
2
is available, the change in color indicates the change of SpO
2
values.
(4) When EDVI or GEDI is available, the size change in the diastole indicates the change of end diastolic volume index.
For more information, see
33.3.2.3End Diastolic Volume Status.
(5) When ELWI is available, the change in liquid level of lung indicates the change of ELWI values. For more information,
see
33.3.2.2Lung Water Status.
(6) When RVEF or GEF is available, the size change in the systole indicates the change of ejection fraction. For more
information, see
33.3.2.4Ejection Fraction Status.
 Loading...