27 - 2 BeneVision N Series Patient Monitor Operator’s Manual
• External radiating devices may disturb the measurement. It is recommended to avoid the use of
electrical radiating equipment in close proximity to the monitor.
• Interference from ECG can be eliminated by adjusting the filter settings.
• The EEG accessories are purchased from EB Neuro S.p.A. Please contact EB Neuro or visit its website
(www.ebneuro.com) for more information.
• In case of electrode off, the monitor provides the error indication only when it performs auto sensor
check according to the interval time (which is set by user). Therefore, immediately start manual
sensor check if abnormal waveform and/or high noise is found.
27.3 EEG Parameters
EEG monitoring provides ten parameters: SEF, MF, PPF, TP, SR, EMG, Delta, Theta, Alpha, and Beta. The numerics
area of each EEG channel can display up to six parameters.
27.4 EEG Display
Label Description
SEF
(Spectrum Edge Frequency)
The frequency at which 95% of the total power lies below it and 5%
lies above it. Its range is from 0.5 to 30.0Hz.
MF
(Median Frequency)
The frequency at which 50% of the total power lies below it and 50%
lies above it. Its range is from 0.5 to 30.0Hz.
PPF
(Peak Power Frequency)
The PPF is the frequency with the highest measured amplitude range
from 0.5 to 30 Hz.
TP
(Total Power)
TP numeric is a measure of the absolute total power in the frequency
range from 0.5 to 30.0 Hz. The useful range is from 40 to 100 db.
SR
(Suppression Ratio)
SR numeric is the percentage of time in the past 60 seconds in which
the EEG signal is considered suppressed.
EMG
(Electromyography)
EMG bar graph reflects the electrical power of muscle activity and
high frequency artifacts. Low EMG indicates that EMG activity is low.
Delta%, Theta%, Alpha%, Beta%
(Frequency band ratio)
EEG is traditionally divided into four frequency bands: delta, theta,
alpha and beta. Frequency band ratio is the percentage of total
power falling in corresponding band. For example, Delta % = Power
in delta band/Total power.
Alpha waves: 8 to 13 Hz
Beta waves: 13 to 30 Hz
Theta waves: 4 to 8 Hz
Delta waves: 0.5 to 4 Hz
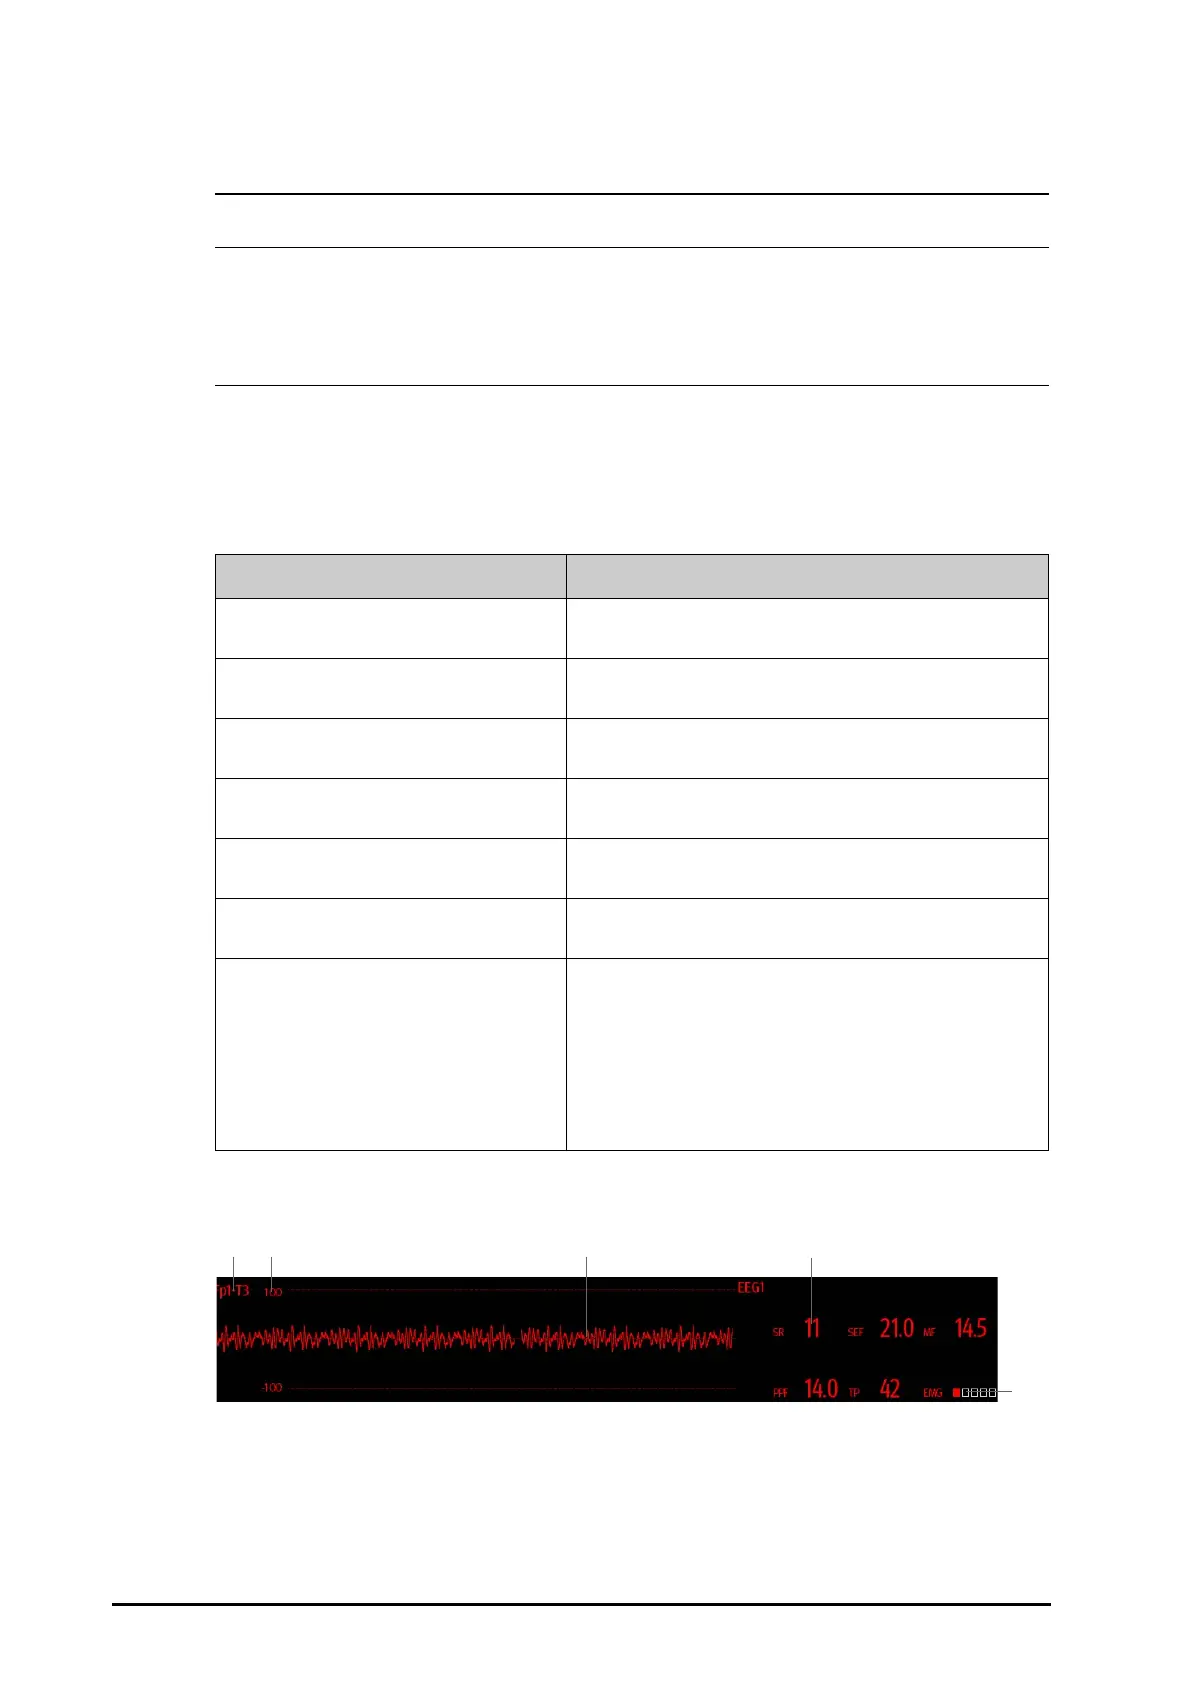
(1) Lead label
(2) EEG waveform scale. For more information, see
27.8.1Changing the EEG Scale.
(3) EEG waveform
You can configure the displayed EEG waveforms. A maximum of four EEG waveforms can be displayed.
 Loading...