33 - 12 BeneVision N Series Patient Monitor Operator’s Manual
33.6 Evaluating the Hemodynamic Parameters
You can review the hemodynamic parameter trends on the Evaluation page. The changes of hemodynamic
parameters are shown by the trends or spider vision diagram. The trends and spider vision diagram display both
current values and reference values of parameters, which let you conveniently see the hemodynamic status at
different timepoints.
To enter the Evaluation page, follow this procedure:
1. Access the HemoSight menu. For more information, refer to 33.2Accessing the HemoSight Menu.
2. Select the Evaluation tab.
33.6.1 Viewing the Spider Vision Diagram
The spider vision diagram shows hemodynamic parameters in dynamic conjunction. To enter the Spidervision
diagram, follow this procedure:
1. Access the HemoSight menu. For more information, refer to 33.2Accessing the HemoSight Menu.
2. Select the Evaluation tab.
3. Select the Spidervision tab.
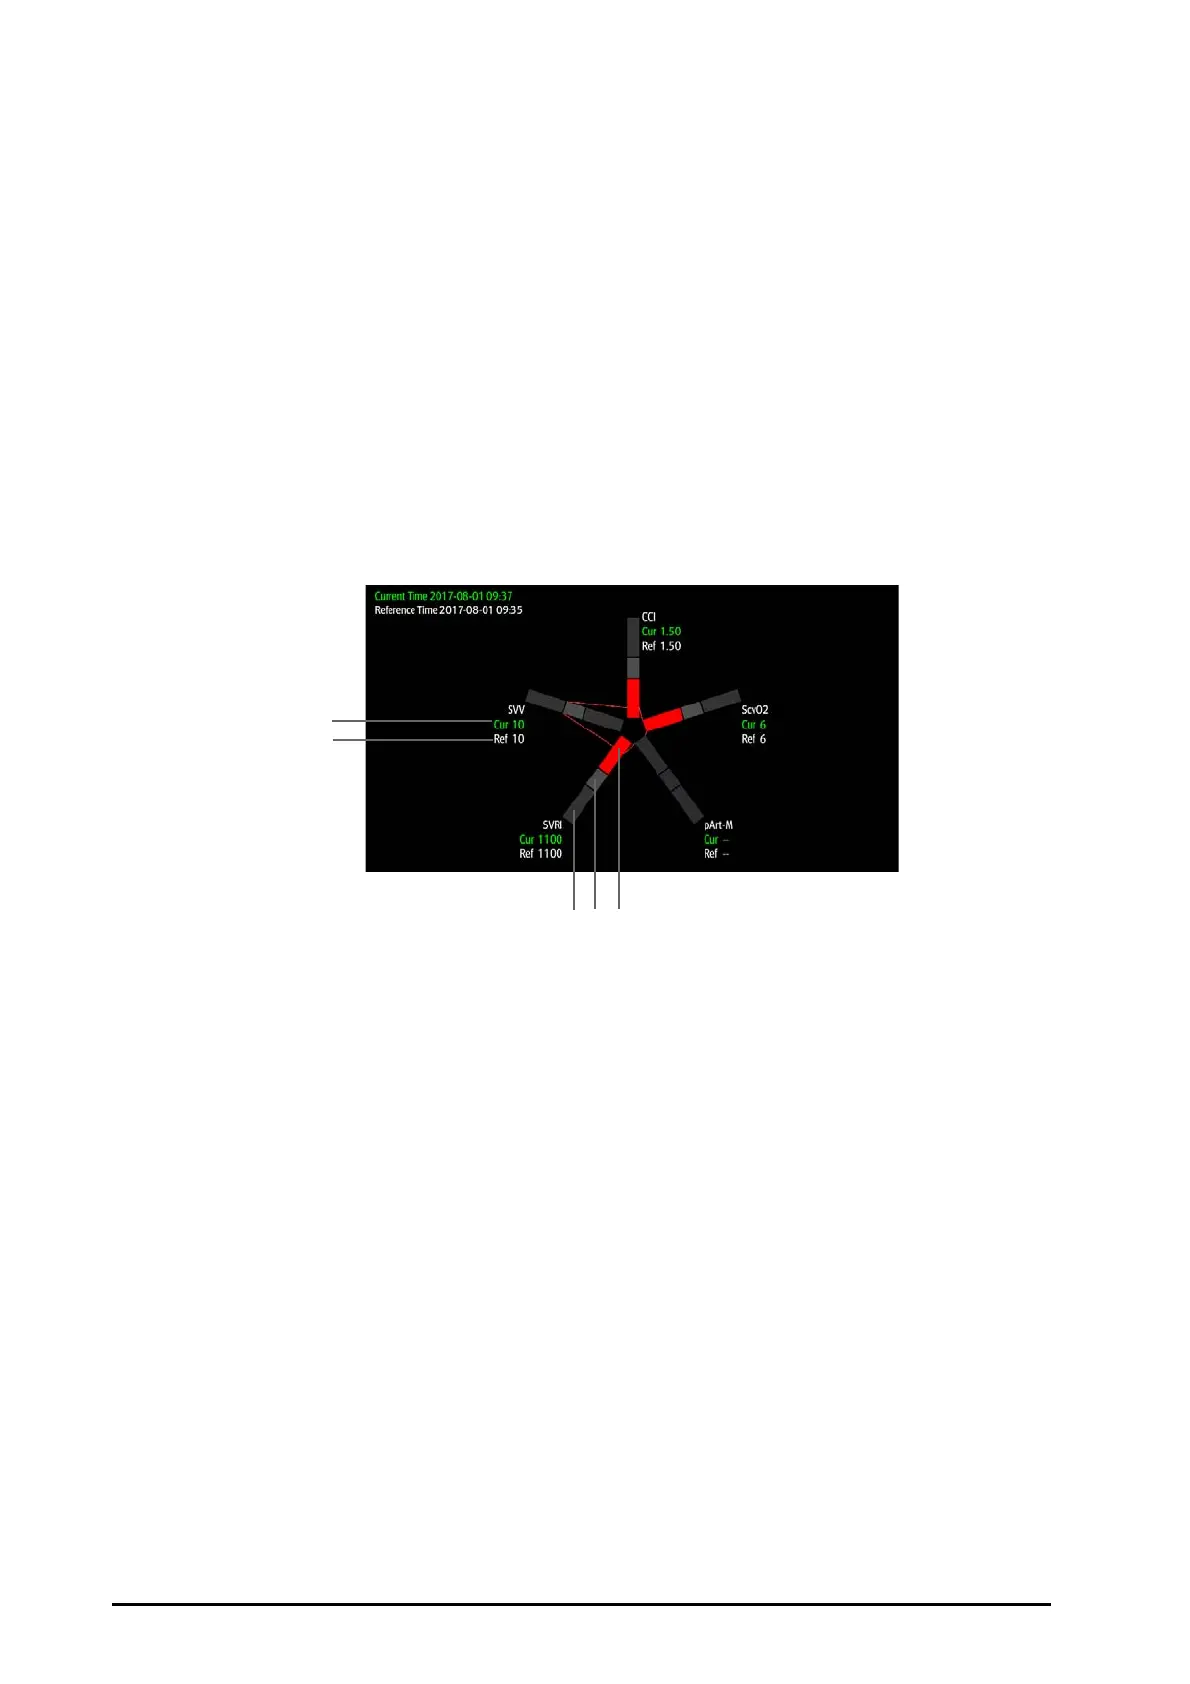
Each spider leg is divided into 3 segments indicating diff
erent value ranges for the respective parameters. The
middle segment indicates the normal range for the respective parameter. The outer segment will be highlighted
when corresponding parameter value exceeds the upper limit. The inner segment will be highlighted when its
corresponding parameter value exceeds the lower limit.
■ The links between spider legs are displayed in green when all displayed parameters are within the normal
range.
■ The links between spider legs and the corresponding spider segment are displayed in yellow immediately
when one of the displayed parameters is outside the normal range.
■ The links between spider legs and the corresponding spider segments are displayed in red when two or
more displayed parameters are outside the normal range.
33.6.2 Viewing Trends
To view the trends of hymodynamic parameters, follow this procedure:
1. Access the HemoSight menu. For more information, refer to 33.2Accessing the HemoSight Menu.
2. Select the Evaluation tab.
3. Select the Trends tab.
For more information on trends review, see 32.2.2Example Review Page.
(1) Current value (2) Reference value (3) Outer segment
(4) Middle segment (5) Inner segment
 Loading...