BeneVision N Series Patient Monitor Operator’s Manual 11 - 21
11.8.7 Entering the ST Graphic Window
To display ST Graphic window, follow this procedure:
1. Select ST numeric area, ECG numeric area, or ECG waveform area to enter the ECG menu.
2. Select the ST tab.
3. From the bottom of the menu, select ST Graphic.
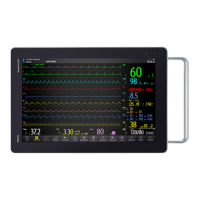
The following figure shows the ST Graphic when ST Alarm Mode is set to Absolute. The height of the bar
indicates the ST value of corresponding ST lead. The color of the bar indicates ST alarm status: green indicates
that corresponding ST value is within alarm limits; cyan, yellow and red indicate that the ST value exceeds the
alarm limits. The color matches ST alarm priority.
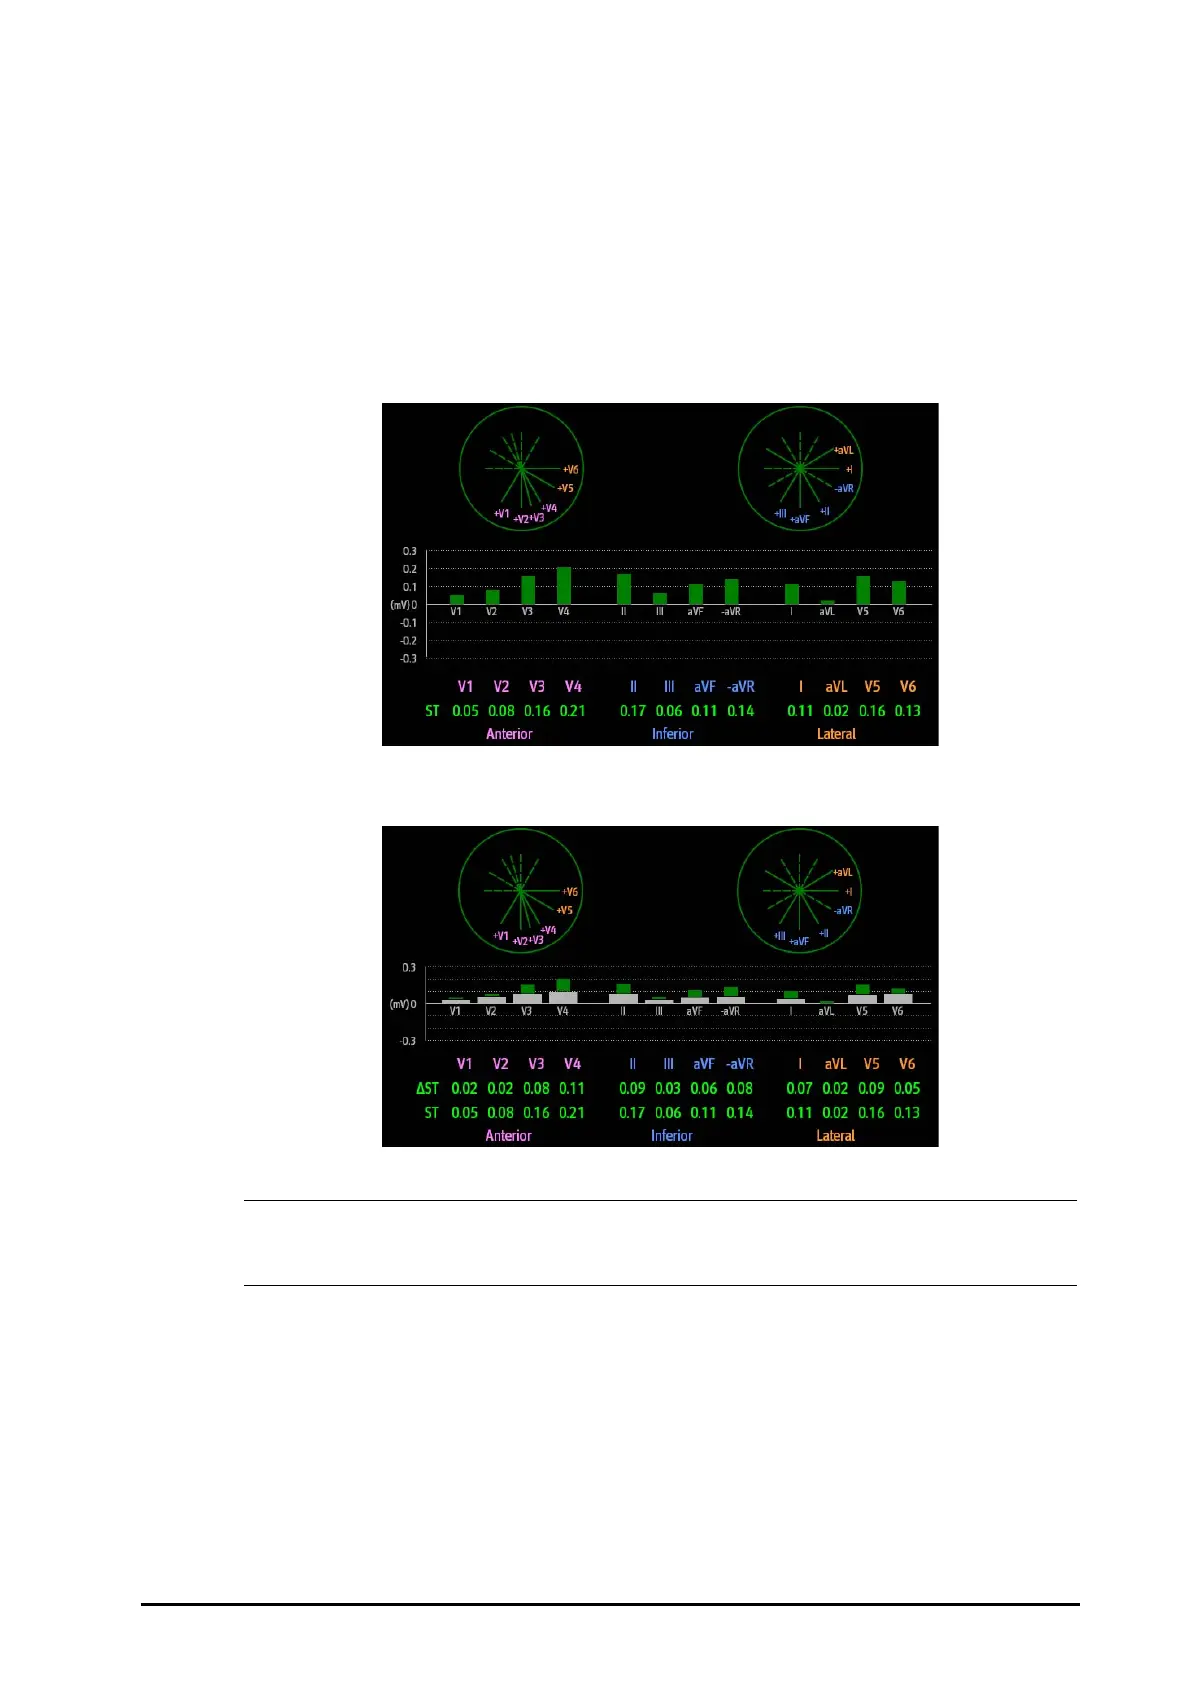
The following figure shows the ST Graphic when ST Alarm Mode is set to Relative. The height of grey bar
indicates the baseline ST value and the green bar (cyan, yellow or red if an alarm occurs) indicates ST.
• In the ST Graphic, the derived leads are marked with a "d" in front of the lead label, for example
“dV1”.
11.8.8 Changing ST Settings
11.8.8.1 Setting ST Alarm Properties
To set ST alarm properties, follow this procedure:
1. Select the ST numeric area, ECG numeric area, or ECG waveform area to enter the ECG menu.
2. Select the ST tab→ Alarm tab.
3. Set ST Alarm Mode to Absolute or Relative.
 Loading...