Spectrum Measurements
R&S
®
ESR
268User Manual 1175.7068.02 ─ 12
Result Evaluation
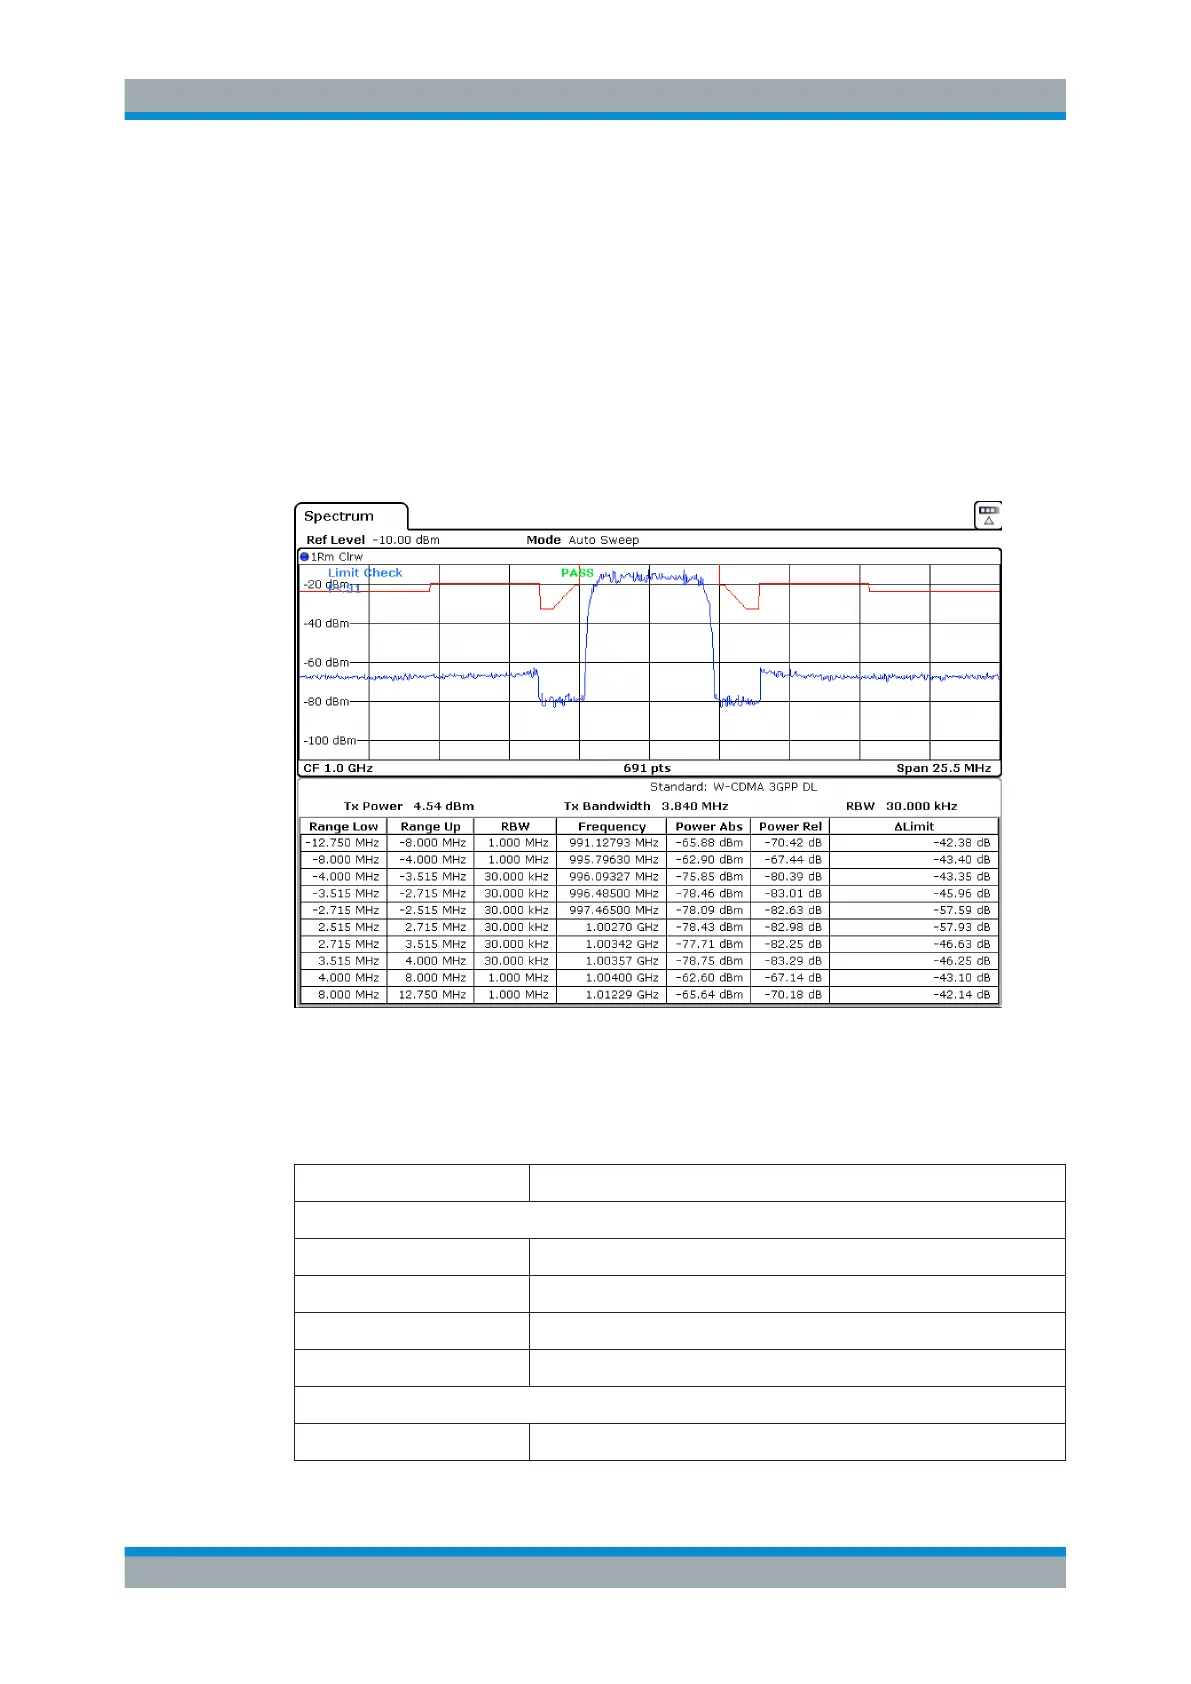
As a result of the Spectrum Emission Mask measurement, the measured signal levels,
the result of the limit check (mask monitoring) and the defined limit line are displayed in
a diagram (see also "Working with Limit Lines in SEM Measurements" on page 271).
Furthermore, the TX channel power "P" is indicated in relation to the defined power
class ranges.
Example:
For example, "P<31" is indicated if the lowest power class is defined from infinity to 31
and the power is currently 17 dBm.
In addition to the graphical results of the SEM measurement displayed in the diagram,
a result table is displayed to evaluate the limit check results (see also "Working with
Limit Lines in SEM Measurements" on page 271).
The following information is provided in the result table:
Label Description
General Information
Standard Loaded standard settings
Tx Power Tx channel power
Tx Bandwidth Tx channel bandwidth
RBW RBW for the Tx channel
Range results
Range Low Frequency range start for range the peak value belongs to
Measurements
 Loading...