Basic Functions
66 9836 3521 01
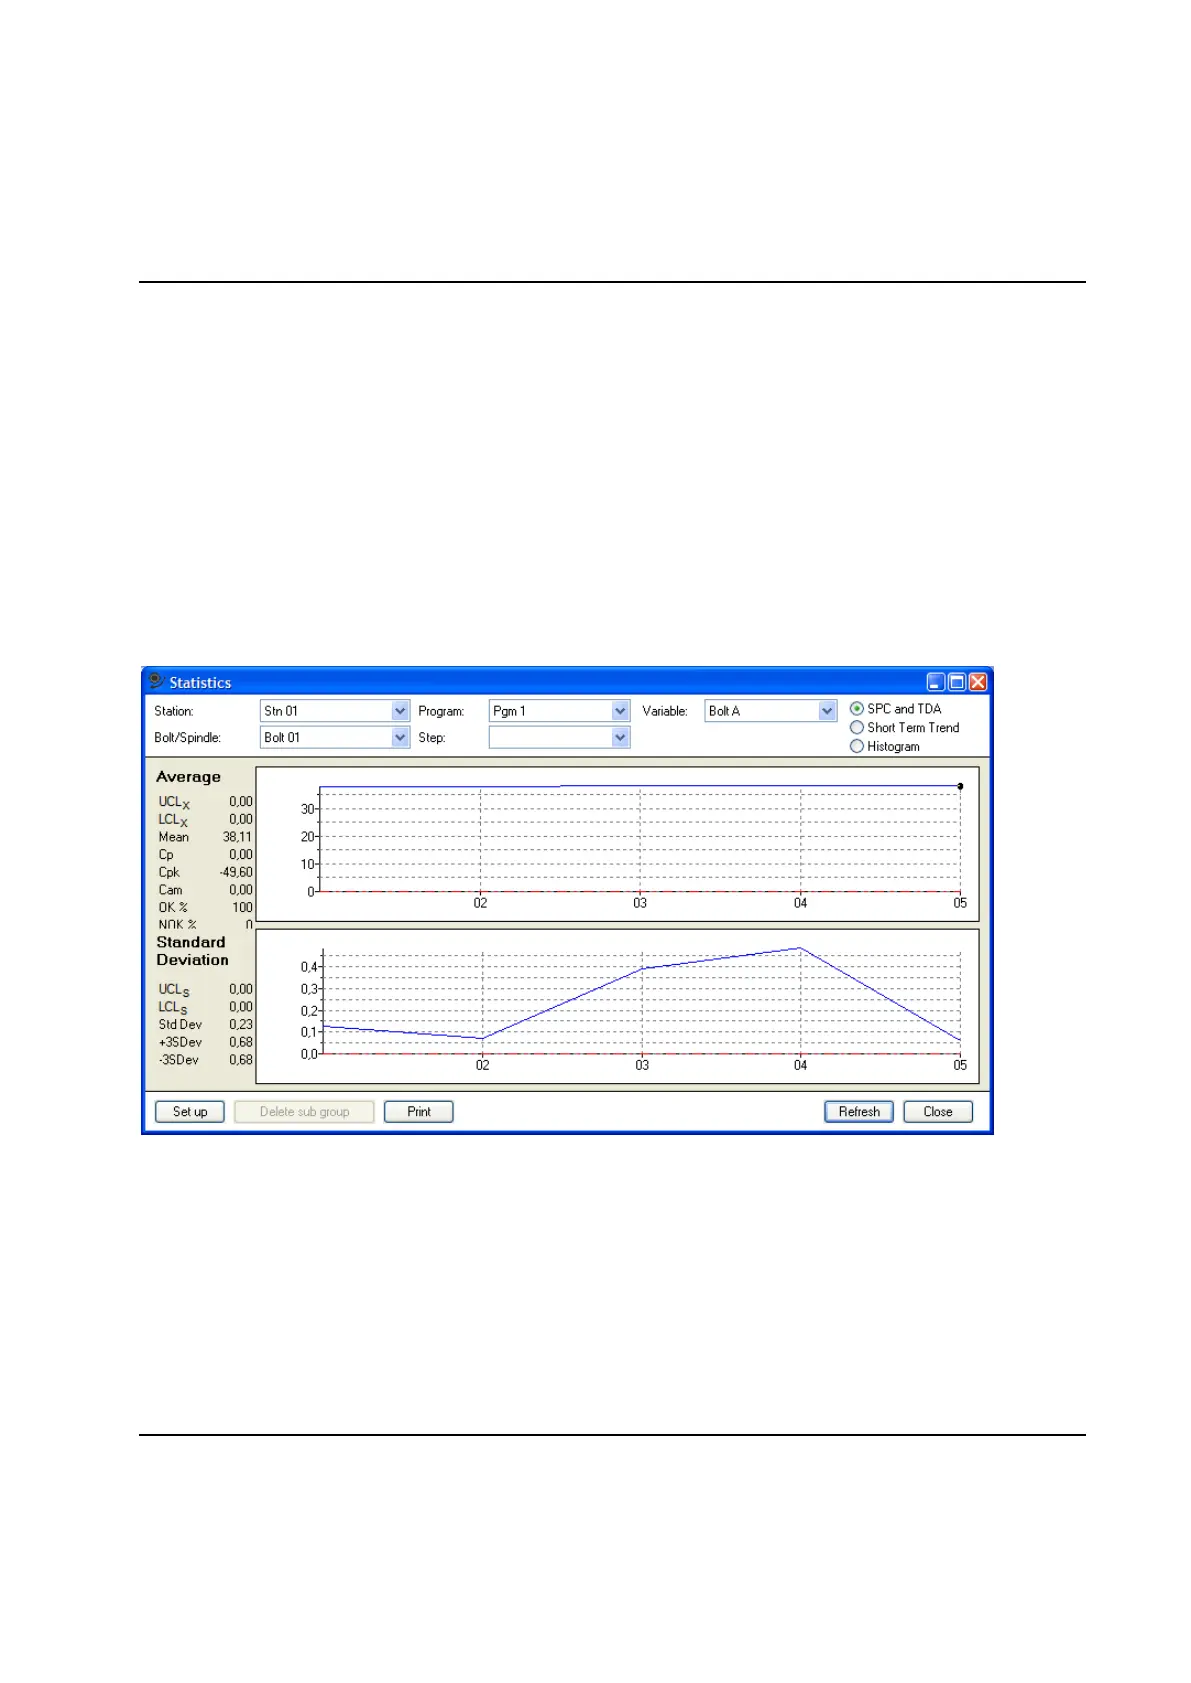
3.6.4 View Statistics
The Statistics window displays the statistical curves generated by the function "SPC, Statistical Process
Control".
First select with Station, Bolt or Spindle, Program, Variable, and Step what variable you want to study
the statistics for. Only values earlier configured for SPC using the SPC set up form can be displayed.
Then use the radio buttons in the upper right corner of the form to select which type of display you want.
The following types are available:
Average and Standard Deviation/Range curves for SPC and TDA
Average and Standard Deviation/Range curves for Short Term Trend
Histogram
With the cursor you can mark a specific part of the trace to zoom in. Place the mouse pointer on the upper
left corner of the area you want to enlarge. Press the left mouse button and drag the mouse pointer to the
lower right corner of the area to zoom in and release the mouse button. This will cause the graph to be
redrawn displaying only the selected area. Click on the right mouse button to zoom out.
When the mouse pointer is located over the graph area a box under it will display the value of the x and y
coordinates pointed at.
If you select All Bolts or All spindles the SPC diagram will show you SPC statistics based on data from
all bolts or spindles in a station weighed together to a measure of the station as a whole. Only variables
already set up for collection from this station are used when calculating the resulting values.
 Loading...