Basic Functions
72 9836 3521 01
3.6.5.2 View of trace curves
In the middle of the Trace viewing window, the curves are plotted for the selected traces and selected
quantities.
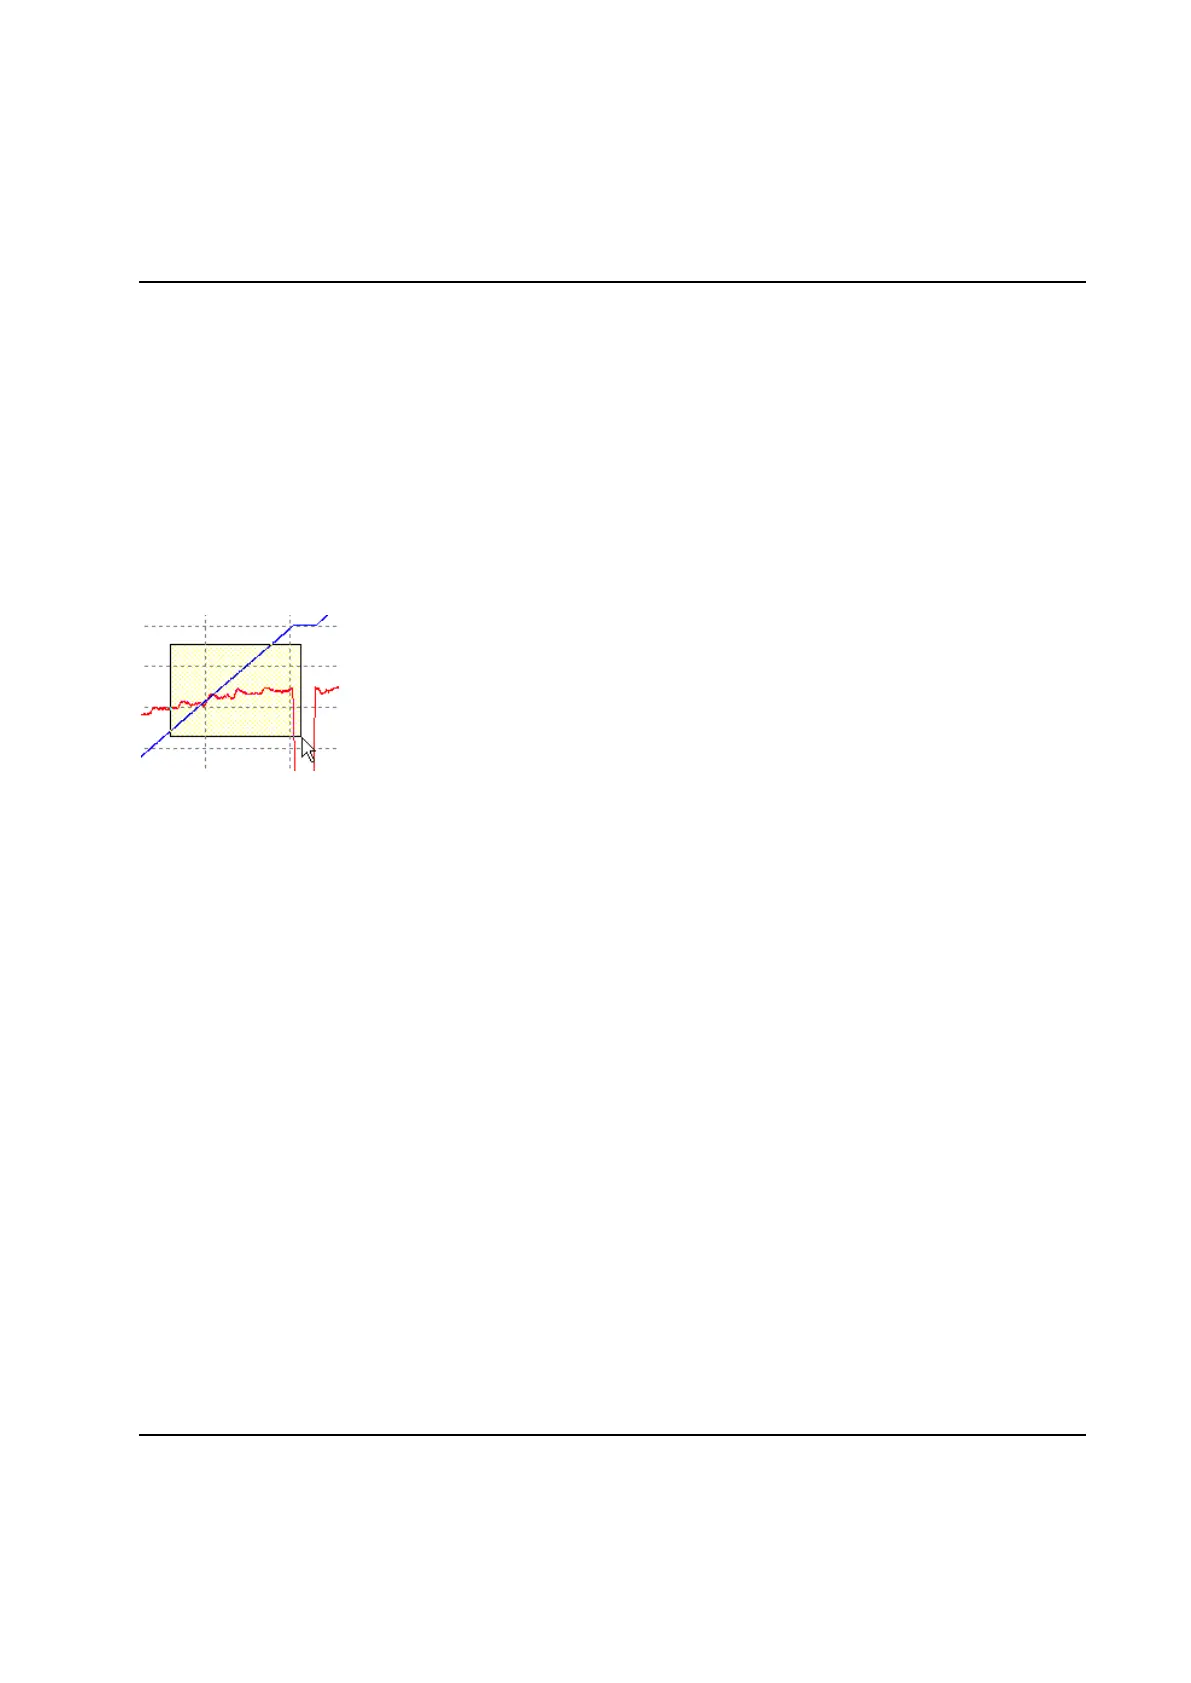
Zoom
With the cursor you can mark a specific part of the trace to zoom in. Place the mouse pointer on the
corner of the area you want to enlarge. Press the left mouse button and drag the mouse pointer to the
opposite corner of the area to zoom in and release the mouse button. This will cause the graph to be
redrawn displaying only the selected area.
Click on the right mouse button to zoom out.
Scroll
When the graph is zoomed in, you can scroll the graph to be able to follow a curve. Place the mouse
pointer on the graph. Press the right mouse button and drag the mouse pointer while holding down the
right button. The graph is redrawn continously while the mouse is moved.
Trace and sample details
Click on the link "Show Details" in the lower right corner to show detailed information about the trace and a
specific point on the curve.

 Loading...