10.4.4.2 Setting trace views
In order to permit
a precise evaluation of the recorded signals, you have the option to edit the
view as well as the display of the characteristic graphs:
● Selection/legend
– Show legend: In addition to the graphic display, the data of the variable is displayed as
comment, numbered and in color.
– Make a selection: You define which variables are displayed in the graphic window.
● Scale
– Specifying scaling factors for minimum and maximum X and Y value
● Zoom
– Increasing or decreasing the section
● Cursors: The cursor display provides functions that allow one, two or both curves to be
precisely measured.
– Cursor A
– Cursor B
– Both cursors
– Snap to curve: The cursor precisely moves along the curve
– Point mode: Cursor jumps directly to various values.
– High point mode: The cursor jumps from one peak value to the next.
– Low point mode: Cursor jumps to the lowest values.
Requirement
The "Trace" graphic window is open and the trace has been recorded.
Editing curves
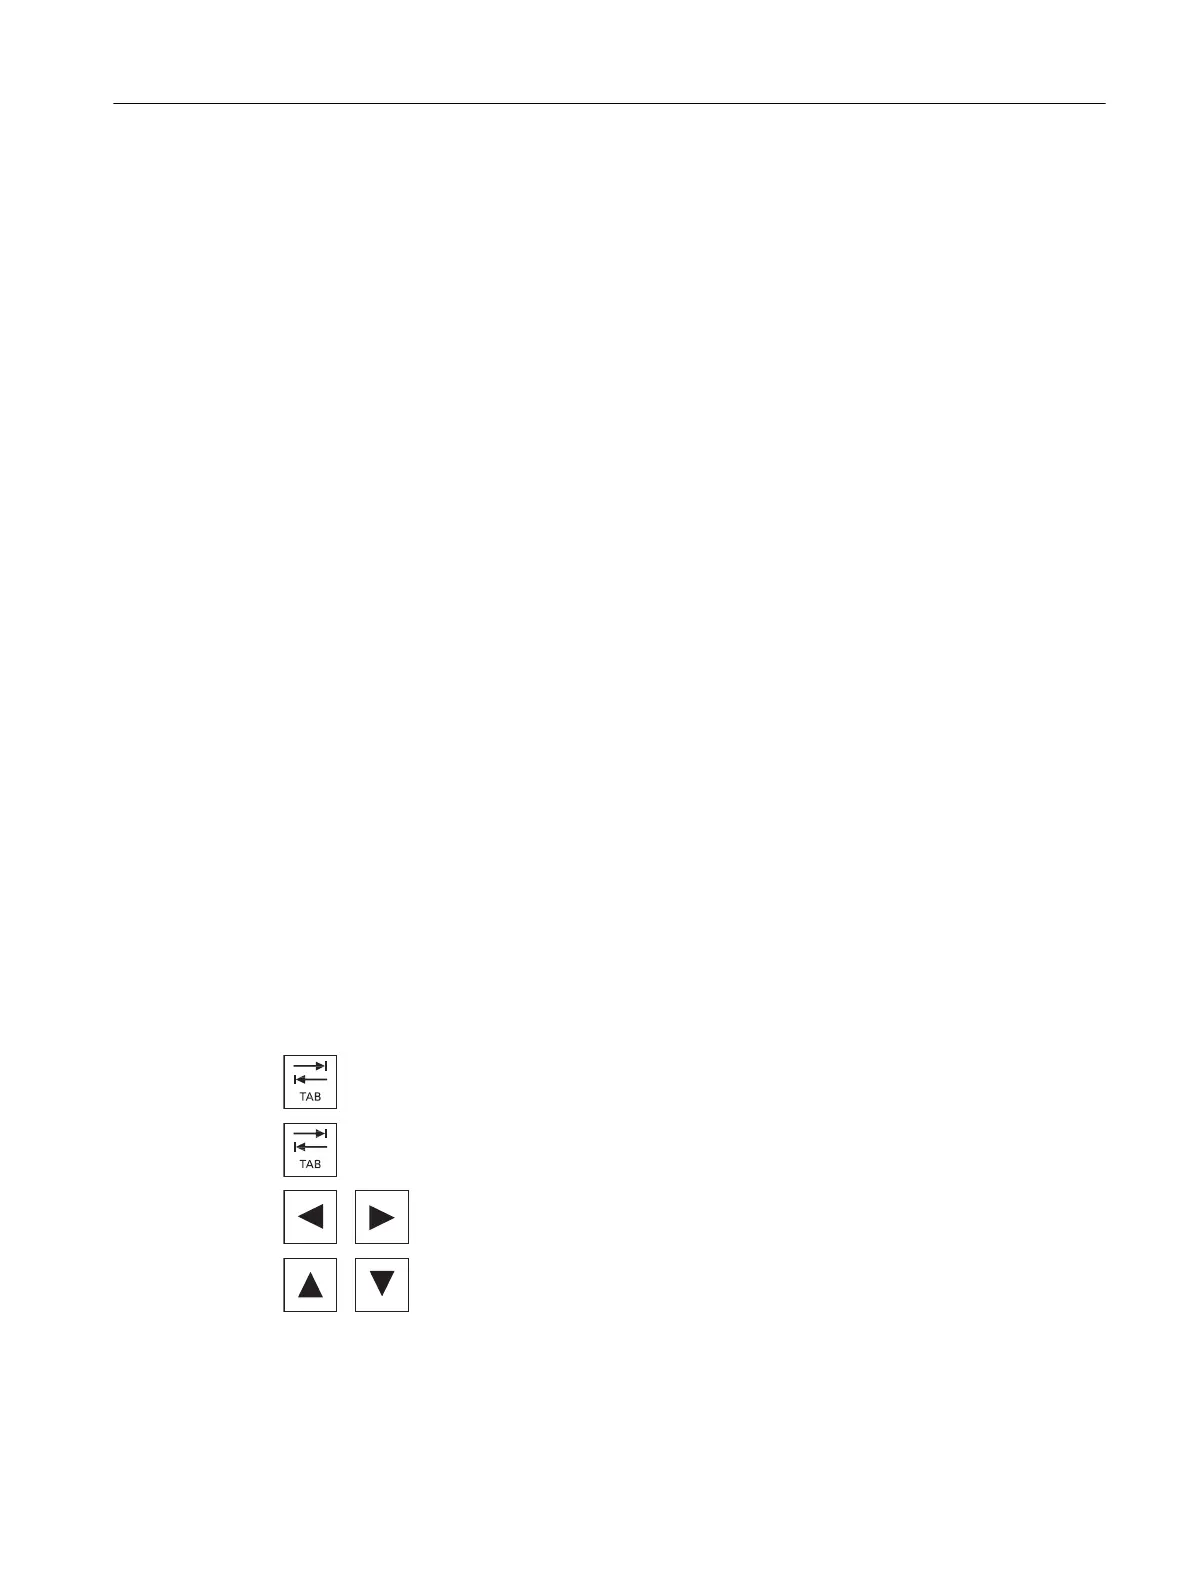
You jump from one variable to the next using the <TAB> key.
You jump back using the <Ctrl> and <TAB> keys.
With the cursor keys, you set marks, move to individual values and can
define a zoom range.
Service and diagnostics
10.4 Trace
SINUMERIK Operate
Commissioning Manual, 10/2015, 6FC5397-3DP40-5BA3 355
 Loading...