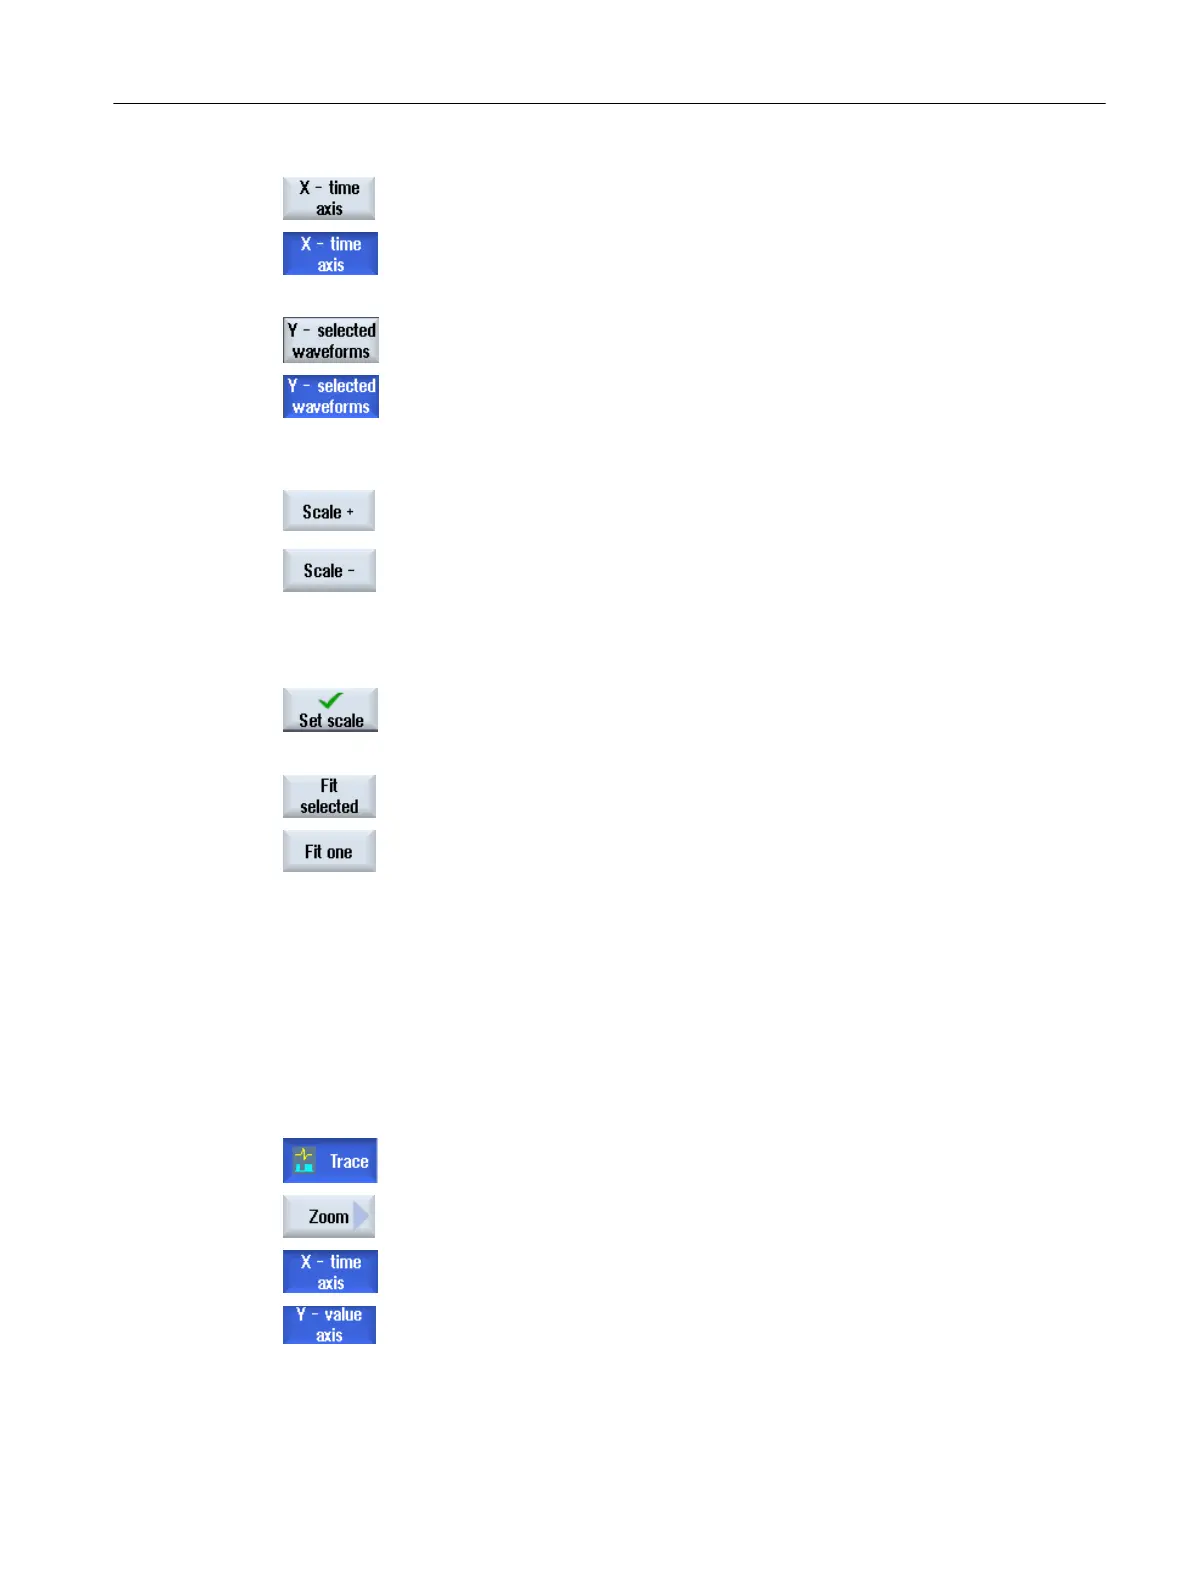
The "Select X-Y Scaling" input window opens and the values of the X time
axis are displayed.
3. Press the "X time axis" softkey again if you wish to hide the values.
- OR -
Press the "Y selected curves" softkey to display the values of the Y value
axis.
Press the softkey again if you wish to hide the values.
- OR -
You have selected both axes.
4. Press the "Scale +" or "Scale -" softkey until the desired scaling is reached.
- OR -
Enter the scaling values directly into the input window and select the ap‐
propriate property.
5. Press the "Scale" softkey to save the settings.
- OR -
Press the "Adapt selected" softkey to display the selected characteristic
graphs in the full graphic window.
Press the "Fit one" softkey to display the selected characteristic graphs in
the full graphic window.
10.4.4.5 Zooming the display
Using the zoom function,
you have the option of viewing selected sections of curves in detail.
After you have defined an area or a section, you can increase or decrease the size of it (zoom
in or zoom out).
Procedure
1. A recording is opened in the "Trace" graphics window.
2. Press the "Zoom" softkey if you wish to zoom-in or zoom-out on the char‐
acteristic graphs.
3. The "X time axis" or "Y value axis" softkey is selected.
Service and diagnostics
10.4 Trace
SINUMERIK Operate
Commissioning Manual, 10/2015, 6FC5397-3DP40-5BA3 357
 Loading...