10.4.4.3 Selecting a variable
You have the option of displaying the selected variables as legend and to make a selection
using a checkbox.
Legend
Numbering the variables
Axis identifier
Comment of the variables
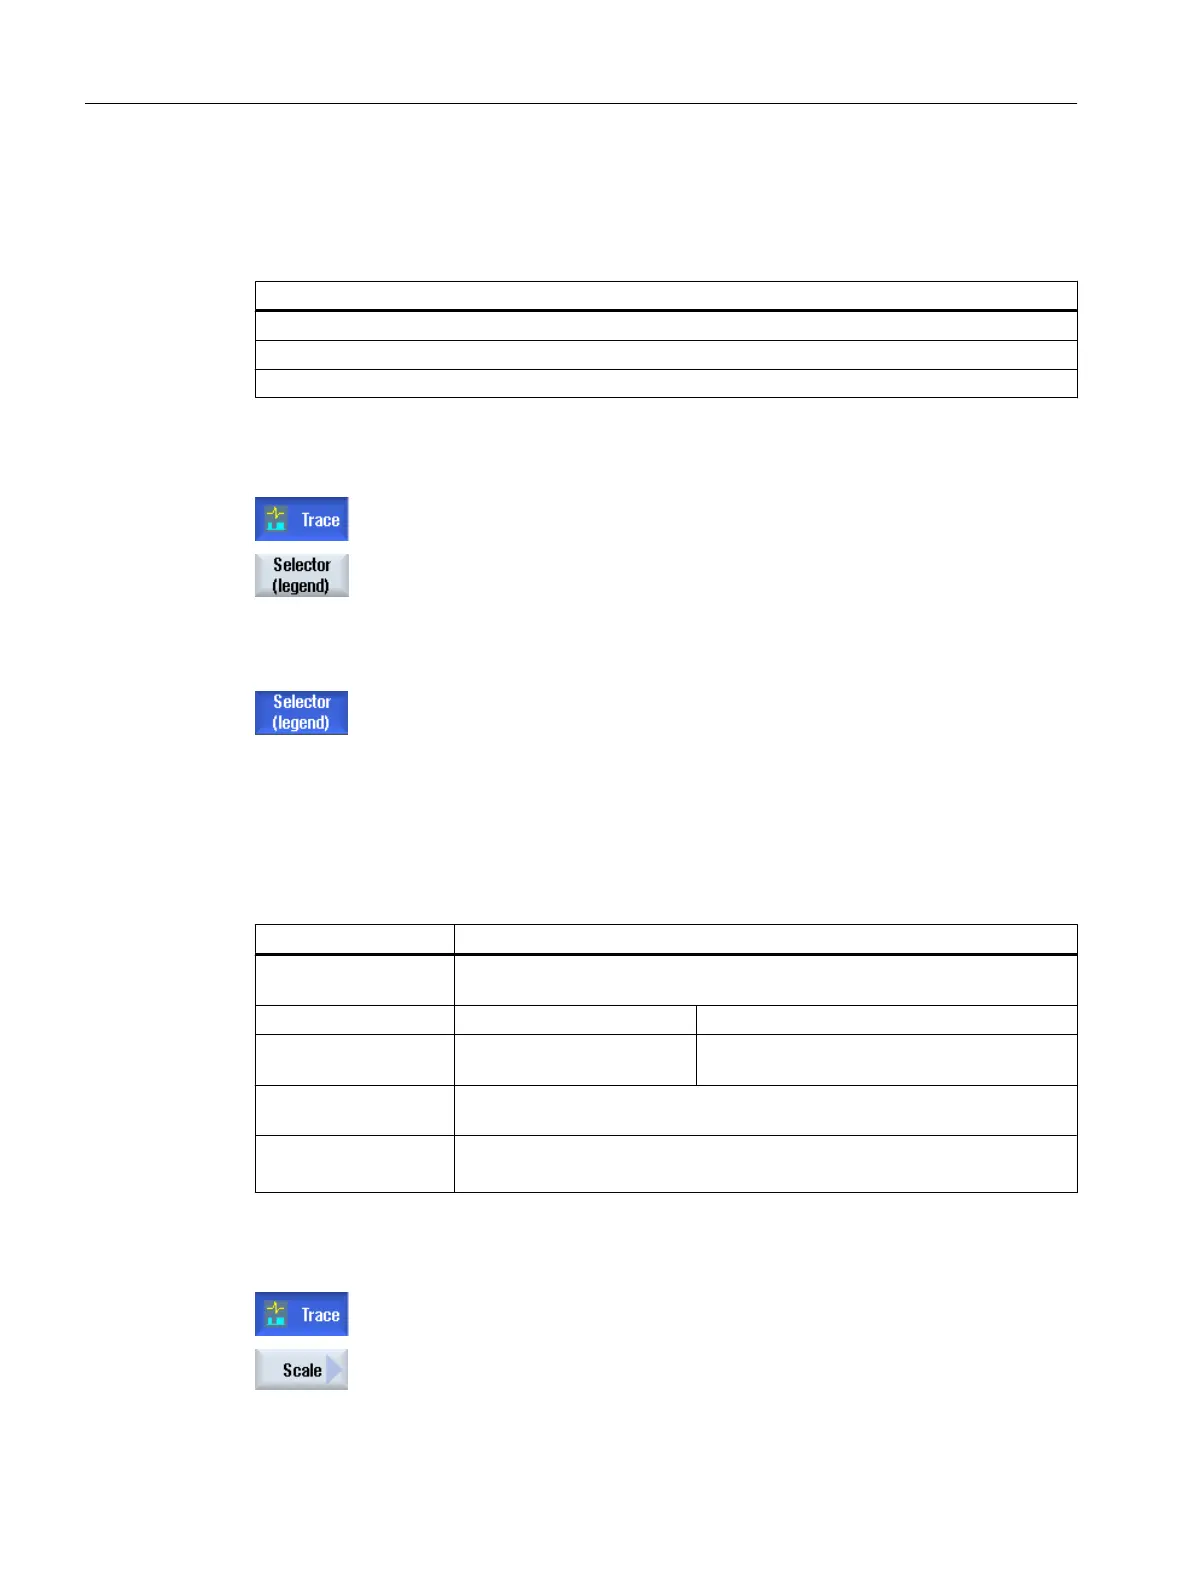
Displaying a legend and selecting a variable
1. A recording is opened in the "Trace" graphics window.
2. Press the "Legend / selection" softkey.
The graphic window is halved. The variables are displayed as comment
and with checkbox in the left-hand section of the window.
3. Activate or deactivate the required variable using the checkbox to display
it as curve.
4. Press the softkey again to hide the legend area again.
10.4.4.4 Scaling the display
The scaling allows you
to make a precise measurement of selected variables from the X time
axis as well as from the Y value axis. You have the option of saving the larger or smaller display
in a user-defined way
Setting Meaning
X minimum or
X maximum
Highest or lowest value of the X time axis. The values are used for recording
when the trace is started again.
Fixed scale, X axis Values of the X time axis are kept.
Strip chart recorder mode The values of the X time axis are used while
recording.
Y minimum or
Y maximum
Defining the highest or lowest value of the Y value axis (amplitude).
Offset or
resolution
Defining the rms values (mean values) of the amplitudes.
The scale is changed by a factor of 10.
Scaling the time and value axis
1. A recording is opened in the "Trace" graphics window.
2. Press the "Scale" softkey in order to scale the display.
Service and diagnostics
10.4 Trace
SINUMERIK Operate
356 Commissioning Manual, 10/2015, 6FC5397-3DP40-5BA3
 Loading...